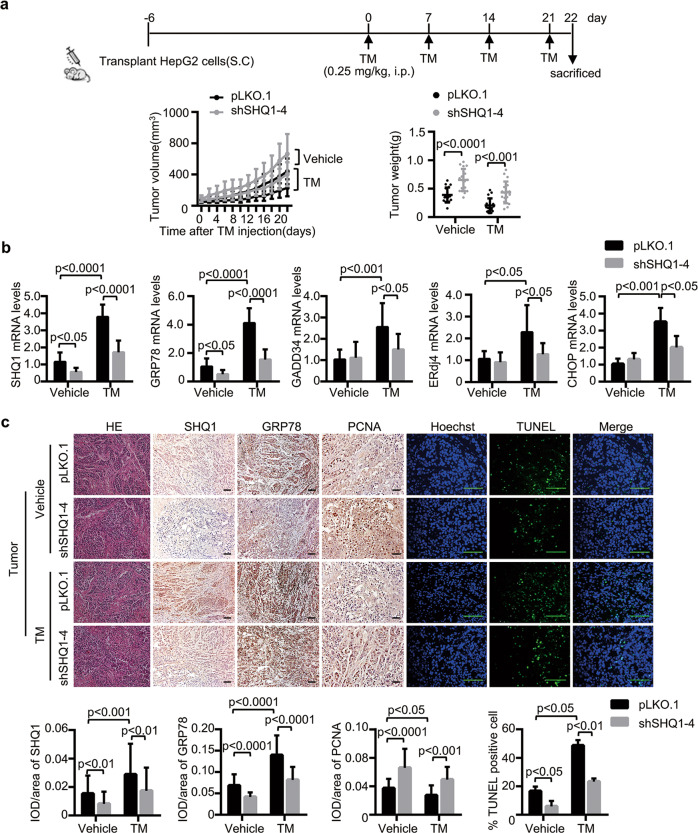
Fig. 3. SHQ1 inhibits tumor growth in xenograft model upon ER stress.
a Scheme of treatment in a HepG2 xenograft tumor model with ongoing induced ER stress. Tumor volumes were measured every other day and plotted. The dot graph on the right shows dissected tumor weights at the end of experiment. Each dot represents the tumor mass from one mouse (n = 18). b UPR-related gene expression in the tumor xenografts was measured using qPCR (n = 3 mice for each group). c The expression of SHQ1, GRP78, and PCNA in the tumor tissues was analyzed using immunohistochemistry and presented as the IDO/area ratio (n = 3 mice for each group). Representative images are shown (×200). Apoptosis was detected using in situ TUNEL staining. The percentage of TUNEL-positive cells/total cells was analyzed in each field under fluorescent microscopy (×400). At least 10 independent random fields were counted for quantifying the data. All scale bars indicate 100 μm. Data shown in this figure are representative of three independent experiments. Quantified data represent the mean ± SD, two-tailed unpaired Student’s t test.

