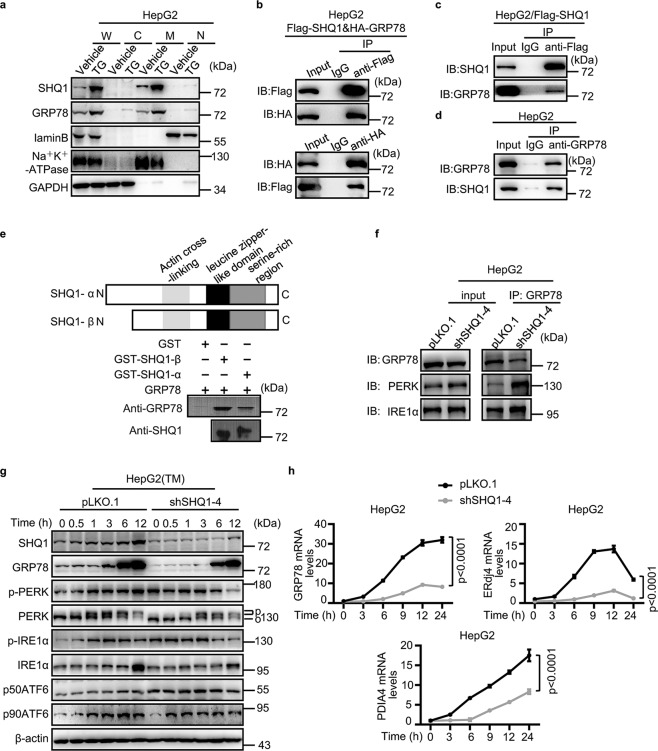
Fig. 4. SHQ1 interacts with GRP78 and hyper-activates UPR.
a HepG2 cells were treated with 100 nM TG as indicated. A commercially available Subcellular Structure Protein Extraction assay kit was used for fractionating the subcellular components. Abbreviations: W whole cell lysate, C cytosolic fraction, M membrane fraction, N nuclear fraction. b, c HepG2 cells were transfected with either Flag-SHQ1 vectors alone or in combination with HA-GRP78 vectors, and were cultured for 24 h. Co-immunoprecipitation analysis for determining the relationship between GRP78 and SHQ1. Anti-Flag or anti-HA antibody was used for immunoprecipitation. The immunorecipitates were determined using western blotting with indicated specific antibodies. d Co-immunoprecipitation analysis for determining the relationship between GRP78 and SHQ1. Anti-GRP78 antibody was used for immunoprecipitation. The immunorecipitates were determined using western blotting with indicated specific antibodies. e N-terminal GST fusion vectors expressing the full length SHQ1 (SHQ1-α) or a naturally expressing truncated version lacking the N-terminus (SHQ1-β) were constructed. Purified recombinant proteins (2 μg) were co-incubated for 2 h in a binding buffer at 4 °C. The immunoprecipitated proteins were detected by western blotting with indicated specific antibodies. f Co-immunoprecipitation analysis for determining the relationship between GRP78 and ER sensors in SHQ1-KD and control HepG2 cells. Anti-GRP78 antibody was used for immunoprecipitation. The amounts of GRP78, PERK, and IRE1α present in the immunoprecipitates were measured using western blotting analyses with the indicated specific antibodies. g SHQ1-KD HepG2 cells and control HepG2 cells were treated with TM for the indicated time points, and the expression of ER sensors was monitored using western blotting. O and P indicate mobility changes for non-activated PERK and activated PERK by phosphorylation. p-PERK, phosphorylated PERK; p-IRE1α, phosphorylated IRE1α; p50ATF6, activated form of ATF6; p90ATF6, the full length precursor form of ATF6. h SHQ1-KD HepG2 cells and control cells were treated with TM for the indicated time points, and qPCR was performed to evaluate the expression of UPR-related genes (n = 3). Quantified data represent the mean ± SD, two-way ANOVA analysis. Data shown in this figure are representative of three independent experiments.

