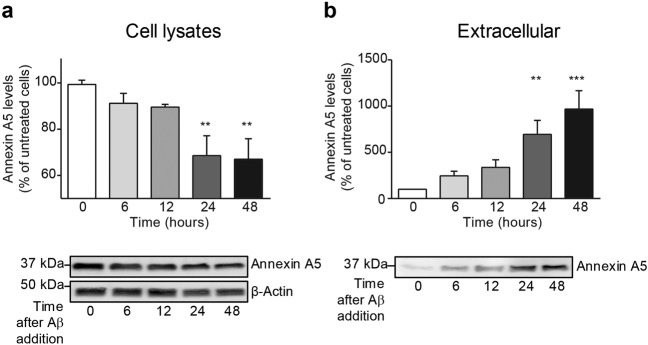
Figure 3.
Analysis of intra- and extracellular annexin A5 levels in choroid plexus cultures after Aβ incubation. (a) Annexin A5 levels in epithelial choroid plexus cell cultures incubated with oligomerised Aβ42 for 6, 12, 24 and 48 hours determined by Western blot. Annexin A5 levels are shown as percentage of untreated cells. β-actin was used as loading control. Histogram reveals a progressive decrease in annexin A5 levels in cells incubated with Aβ42 already significant at 24 hours (upper panel) (**p < 0.01; n = 4). Representative bands of annexin A5 protein levels in choroid plexus cells at 0, 6, 12, 24 and 48 hours after Aβ42 addition (bottom panel). These images were cropped from full-length blots and they are shown in the supplementary information section. In all cases data represents mean ± SEM. (b) Annexin A5 levels in extracellular medium of Aβ42-incubated choroid plexus cells for 0, 6, 12, 24 and 48 hours. Histogram shows a progressive increase of annexin A5 levels in extracellular medium which is already significant 24 hours after Aβ42 incubation (upper panel) (**p < 0.01; ***p < 0.001; n = 4). Representative bands of annexin A5 protein levels in extracellular medium at 0, 6, 12, 24 and 48 hours after Aβ42 addition (bottom panel). This image was cropped from a full-length blot shown in the Supplementary Information section. In all cases data represents mean ± SEM.

