Figure 6.
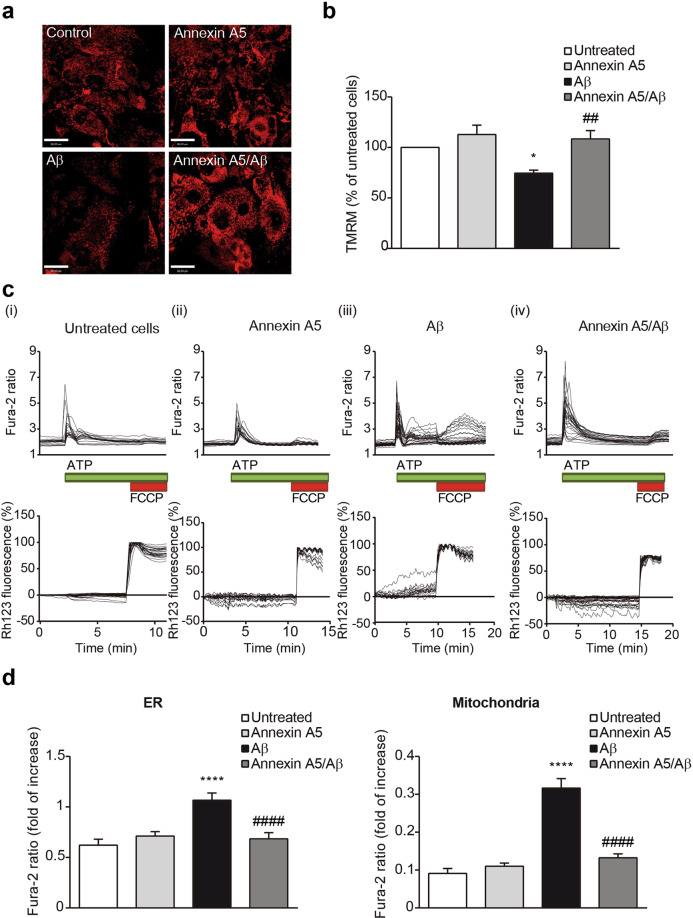
Annexin A5 restores mitochondrial depolarisation in Aβ-treated choroid plexus cultures in a Ca2+-dependent manner. (a) Representative images of tetramethyl-rhodamine methylester (TMRM) fluorescence used in redistribution mode (40 nM) in choroid plexus cultures incubated with and without oligomerised Aβ42 (10 µM), in absence and presence of annexin A5 (15 µl/ml). (b) Annexin A5 restored the Aβ-induced mitochondrial depolarisation. Data were normalised to untreated cells and are represented as mean ± SEM from at least three independent experiments. (*p < 0.05 versus untreated cells; ##p < 0.01 versus Aβ42-treated cells; n = 4). (c) Traces showing changes-over time in fura-2 (upper panels) and simultaneous rhodamine 123 (Rh123) (bottom panels) fluorescence in choroid plexus epithelial cells upon physiological Ca2+ stimuli. Physiological Ca2+ was induced by addition of ATP (100 μM). Following Ca2+ release from ER, FCCP (1 μM) was added to obtain the maximal mitochondrial depolarisation allowing mitochondrial Ca2+ release. Upon stimulation of choroid plexus cells with ATP, Ca2+ stored in the ER was released and profound mitochondrial depolarisation was found in Aβ-incubated cells as shown by the increase in the Rh123 signal (iii). This effect was not observed in untreated cells (i) or annexin A5-treated cells only (ii). Annexin A5 treatment prevented the mitochondrial depolarisation when Ca2+ stimulus was added (iv). (d) Histograms showing ER Ca2+ (left panel) and mitochondrial Ca2+ levels (right panel) after addition of ATP and FCCP respectively as explained above. ER Ca2+ in choroid plexus cells incubated with Aβ were higher compared with untreated cells or annexin A5-treated cells only. Annexin A5 co-treatment restored the Aβ-induced increase of ER Ca2+ levels. Mitochondrial Ca2+ in Aβ-incubated choroid plexus cells was significantly higher compared with untreated cells or annexin A5-treated cells only. These levels were restored upon co-incubation with annexin A5. Data were normalised to untreated cells and are represented as mean ± SEM from at least three independent experiments. (****p < 0.0001 versus untreated cells; ####p < 0.0001 versus Aβ42-treated cells; n = 4).

