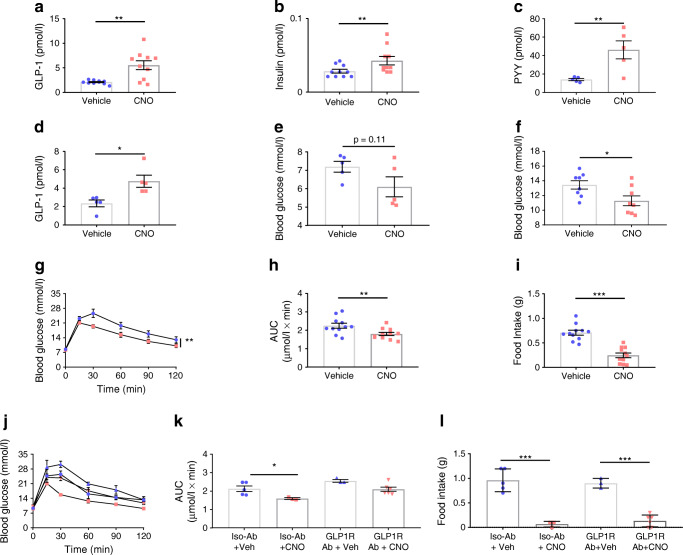
Fig. 2.
Colonic L cell stimulation improves glucose tolerance, actions directly attributable to GLP-1. (a) Plasma GLP-1 (n = 10, crossover design), (b) insulin [data from same samples as in (a)] and (c) PYY (n = 5, non-crossover design) 15 min post administration of vehicle or CNO (at 0.3 mg/kg i.p.). (d) Plasma GLP-1 (n = 5, crossover design) and (e) corresponding blood glucose 30 min post administration of vehicle or CNO (0.3 mg/kg i.p.). (f) Blood glucose in the fed state, 15 min post administration of CNO. (g) IPGTT (2 g/kg body weight glucose, administration of vehicle or CNO (at 0.3 mg/kg i.p., delivered contralaterally to glucose). (h) AUC and (i) 1 h food intake post IPGTT (2 h after administration of glucose). Values presented as group mean ± SEM (n = 11, crossover design). Animals were subsequently pre-treated with a GLP1R antibody (GLP1R Ab) or isotype control antibody (Iso-Ab) (j) IPGTT (as previous), (k) AUC and (l) 1 h food intake post IPGTT post administration of vehicle or CNO (0.3 mg/kg i.p., delivered contralaterally to glucose). Values presented as group mean ± SEM (n = 5–6 mice per group). *p < 0.05, **p < 0.01 and ***p < 0.001 by unpaired Student’s t test (c), paired Student’s t test (a, b, d, e, f, h, i), 1-way ANOVA with Dunnett’s post hoc test (k, l) or 2-way ANOVA (g, j). Circles, vehicle; squares, CNO treated; triangles (up), GLP1R ab + vehicle; triangles (down), GLP1R + CNO

