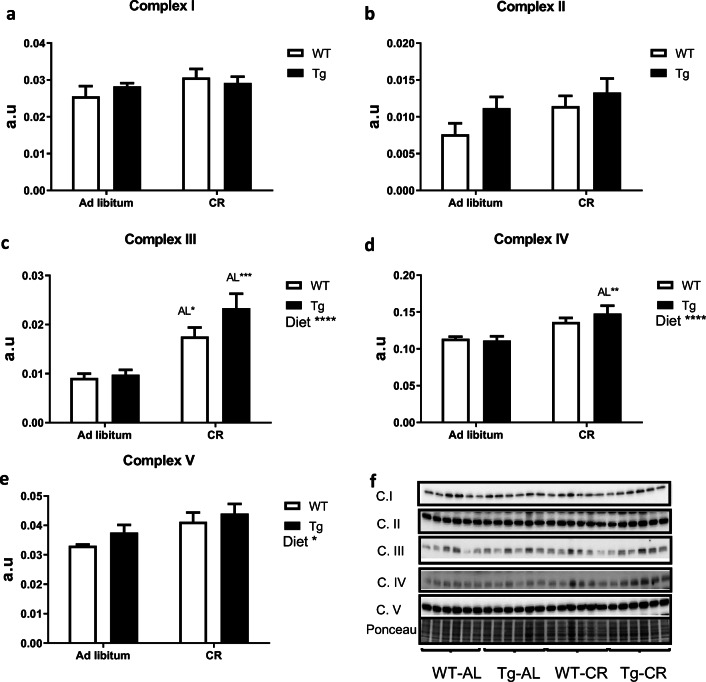
Fig. 6.
Expression levels of mitochondrial electron transport chain complexes in liver from WT and Tg mice fed ad libitum or under CR. a to e represent the levels of mitochondrial complexes I to V, respectively. Statistically significant differences between groups are indicated where detected. Data are mean ± SEM of 6 replicates. Western blots used for quantification of protein levels with their corresponding Ponceau S-stained lanes used for normalization of protein loading (f)

