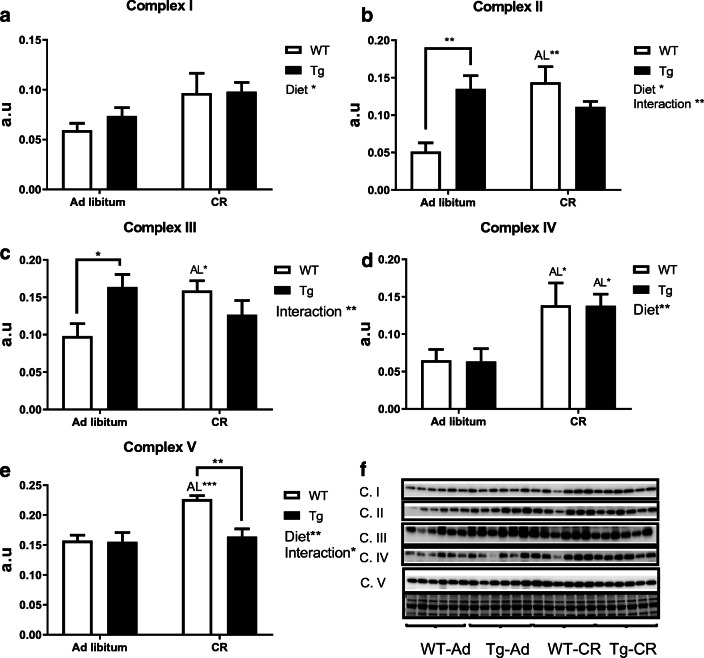
Fig. 7.
Expression levels of mitochondrial electron transport chain complexes quantified in skeletal muscle of WT and Tg mice fed either ad libitum or under CR. a to e represent complexes I to V, respectively. Statistical differences between groups as well as general effect of diet and interactions genotype-diet are indicated on the corresponding panel. Data were represented as mean ± SEM of 6 replicates. Western blots used for quantification of protein levels with their corresponding Ponceau S-stained lanes used for normalization of protein loading (f)

