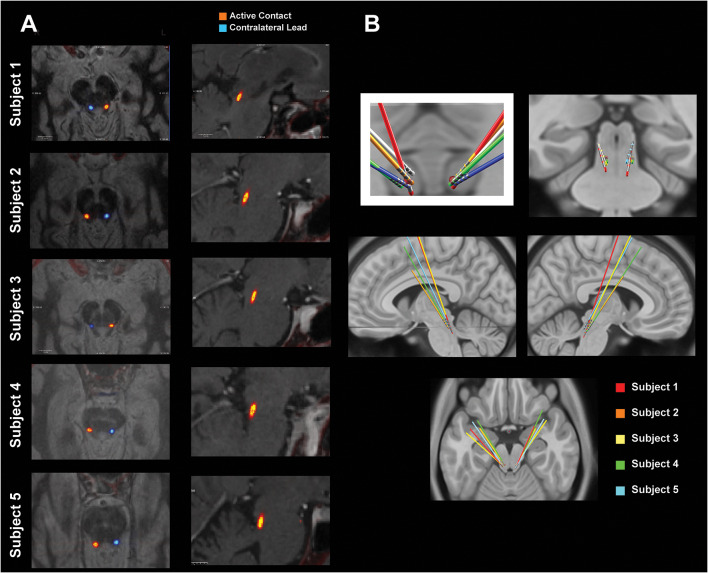
Figure 1.
Pedunculopontine nucleus (PPN) lead localization methods. (A) MRI-CT co-registered images of each subject. The “active contact” marks the center of the bipolar electrode configuration that yielded the feature most correlated with gait. The left panels show T1 inverted axial views of the active contact (orange) and the contralateral lead (blue). The right panels show T2 sagittal views of the active contact. (B) Leads normalized to MNI space using Lead-deep brain stimulation (DBS). All leads are shown with a red dot that roughly defines the location of the PPN.

