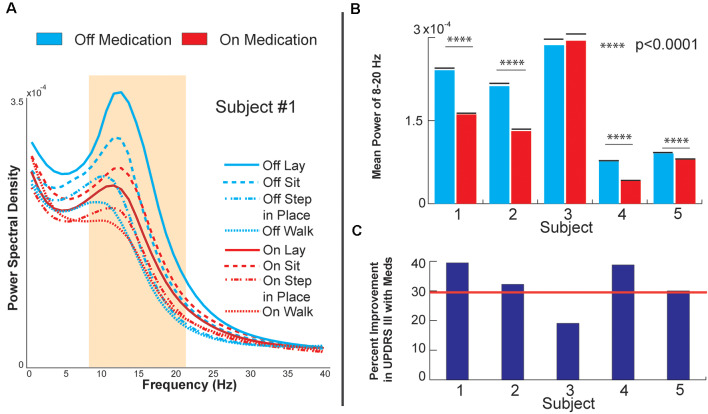
Figure 2.
Globus pallidus internus (GPi) response to medication. (A) Power spectral density of GPi signals from Subject 1, OFF, and ON levodopa medication during various baseline and gait tasks. (B) Bar plots of raw decrease in GPi beta power during sitting (8–20 Hz). (C) Bar plots of each subject’s percent improvement in UPDRS III score from OFF medication to ON medication during sitting. The red line marks a 30% improvement, a commonly employed clinical benchmark for medication responsiveness.

