Figure 3.
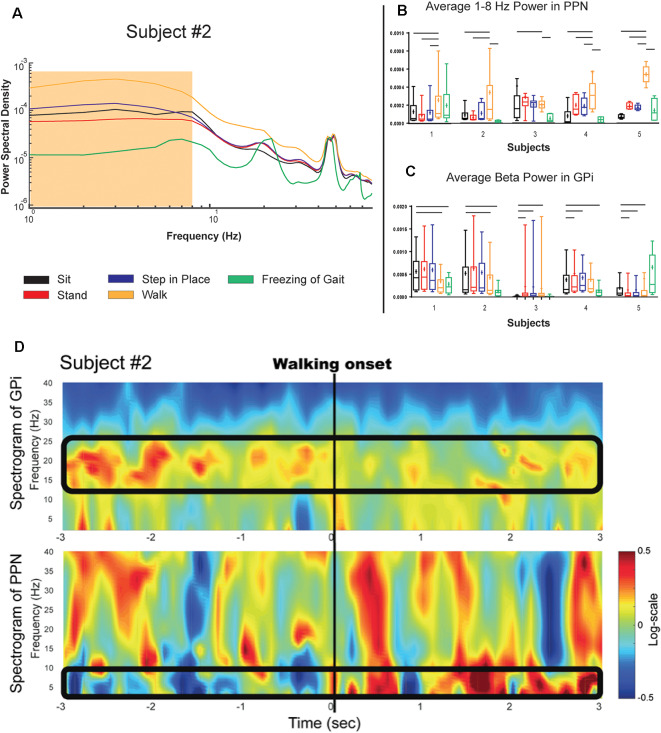
PPN and GPi response to gait tasks in the on medication condition. (A) Logarithmic power spectral density of PPN signal power in a single subject during various balance and gait-related tasks. (B,C) Single-subject (log normalized to standing) demonstrating PPN low frequency and GPi beta modulation with gait onset shown as boxplots. Significance bars indicate that tasks that statistically could be differentiated from gait every month (p < 0.001). Panel (D) Shows the temporal evolution of neural signatures with gait initiation and the spectrogram from the same subject as (A) averaged across gait initiation trials in one session. This subject exhibited a beta peak while at rest, and this beta peak decreased with gait initiation, while the PPN modulated in response to walking in the 1–8 Hz spectral band. The outlined bands show the dissipation of the beta rhythm in the GPi while the PPN feature bands modulated at the onset of gait.

