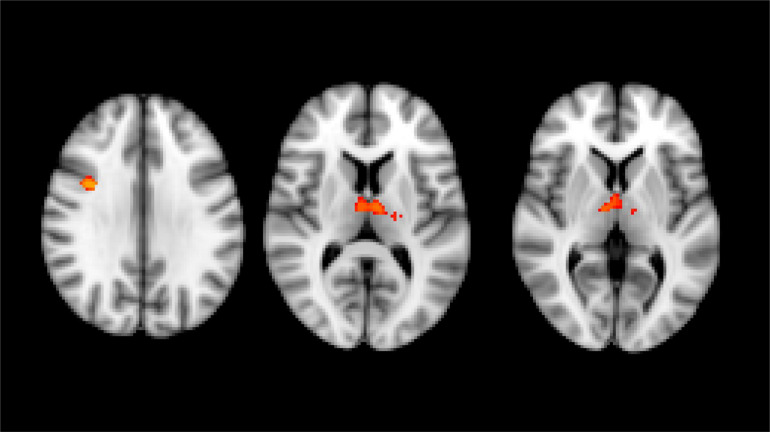
FIGURE 1.
Results of whole brain voxel-based morphometry analyses superimposed on the T1-weighted structural MRI images in the standard MNI space. T-statistics of the clusters with significant changes in between-group VBM analysis at baseline. Red-yellow clusters show gray matter volumetric reduction in HSP patients compared with healthy control group (right prefrontal cortex and both thalami).

