FIGURE 4.
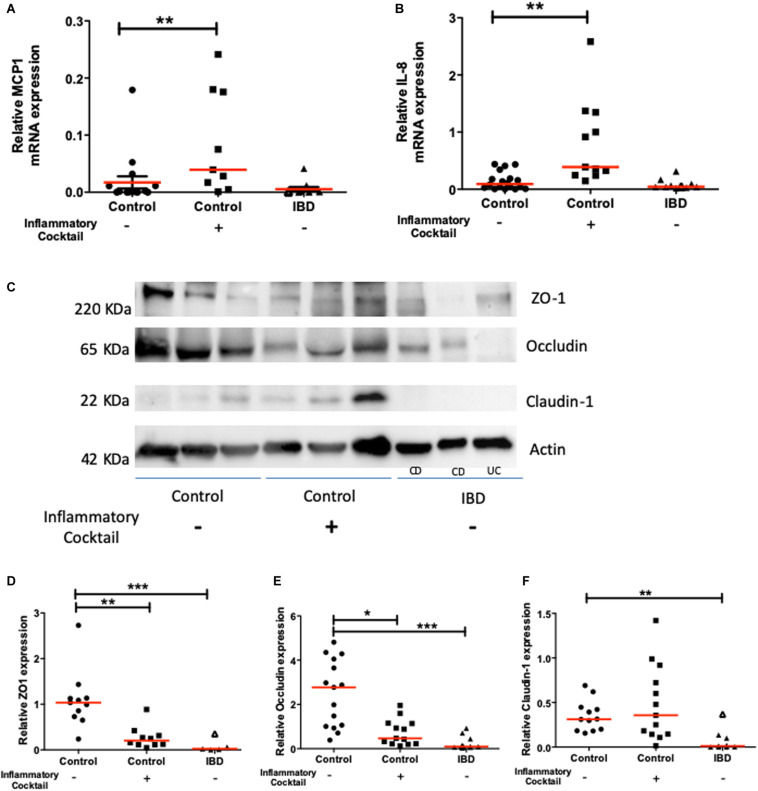
Chemokine (MCP-1 and CXCL-8) and tight junction molecule (ZO-1, Occludin and Claudin-1) mRNA and protein expression respectively, in controls (circles), controls exposed to an inflammatory cocktail (IL-1β, TNF-α, and IL-6, at 10 ng/ml) from day 3 to day 10 (squares) and organoids from IBD patients (triangles): ulcerative colitis (UC) patients (opened triangles) and Crohn’s disease (CD) patients (closed triangles). mRNA or proteins were extracted from organoids after 10 days of culture and data were normalized by GAPDH or actin expression respectively. Red lines represented medians. P-value < 0.05 for *, <0.01 for **, and <0.005 for ***(One-way Anova, Kruskal Wallis, and Dunns). (A) MCP1 mRNA expression. (B) IL-8 mRNA expression. (C) Representative Western-blot of the ZO-1, Occludin, Claudin-1 and Actin protein expression in tissues from 3 representative samples from controls (non-IBD), and IBD (Crohn’s disease: CD, and ulcerative colitis: UC) patients. (D) Quantification of ZO-1 relative protein expression. (E) Quantification of Occludin relative protein expression. (F) Quantification of Claudin relative protein expression.

