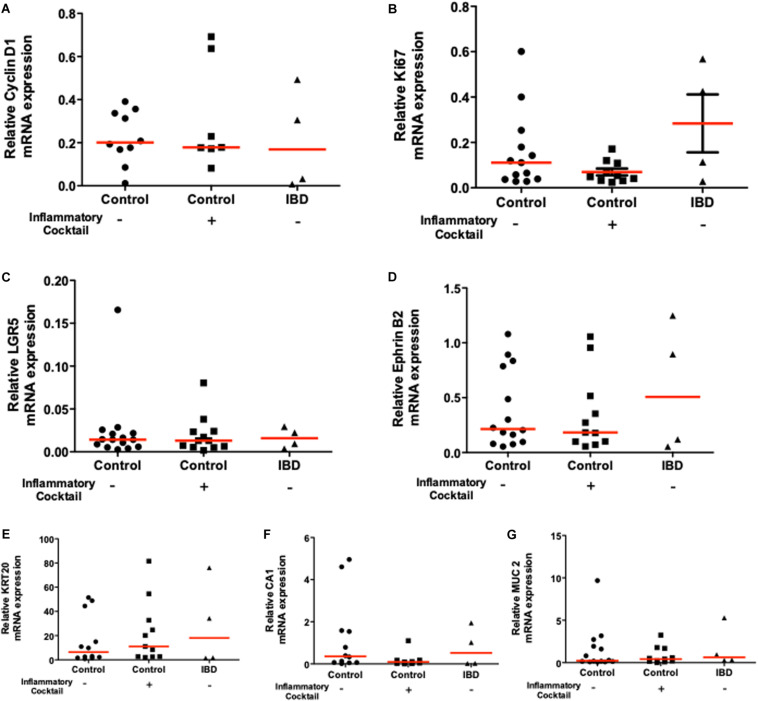
FIGURE 6.
mRNA expression of proliferation markers [Cyclin D1 and Ki67 (A) and (B) respectively], immaturity markers [LGR5 and Ephrin B2 (C) and (D) respectively], and differentiation markers [Carbonic Anhydrase-1: CA1, Cytokeratine-20: KRT20 (E), Carbonic Anhydrase-1: CA1 (F), and Mucin 2: MUC2 (G)] in 10 days cultured organoids from controls (circles), control organoids exposed to inflammatory cocktail (IL-1β, TNF-α, and IL-6, at 10 ng/ml) from day 3 to day 10 of cultures (squares) and organoids from IBD patients (triangles): ulcerative colitis (UC) patients (opened triangles) and Crohn’s disease (CD) patients (closed triangles). Data were normalized to GAPDH. Red lines in graphs represented medians. No statistical significant difference was observed.

