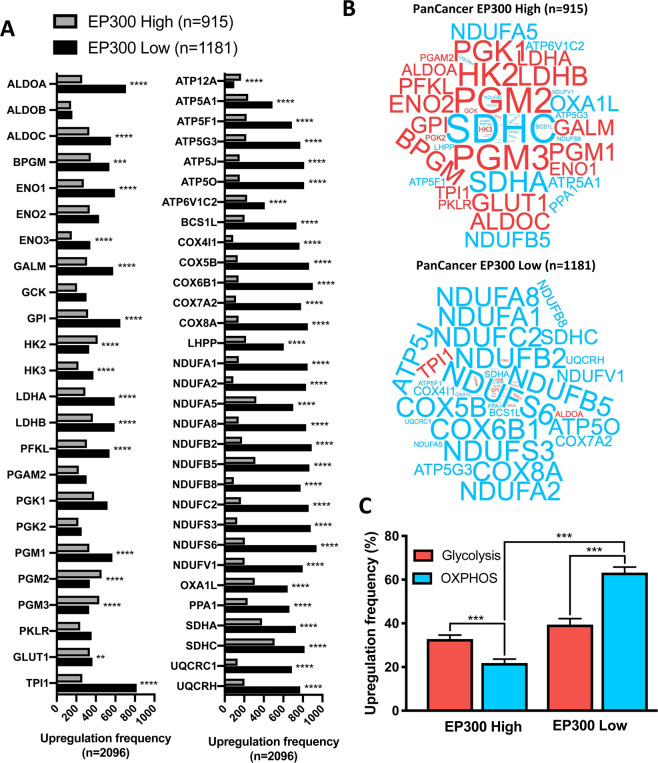
Figure 4.
PanCancer analyses of metabolic phenotypes in relationship to EP300 expression: (A) Absolute upregulation frequency of 24 genes involved in glycolysis and 31 genes invovled in OXPHOS with significant upregulation of all OXPHOS genes, except for ATP12A in EP300 low tumors and significant downregulation of 14 glycolysis genes in EP300 low tumors. (B) PanCancer expression of metabolic genes (red: 24 genes involved in glycolysis; blue: 31 genes involved in OXPHOS) with predominance of glycolytic genes in EP300 high tumors and predominace of OXPHOS-associated genes in EP300 low tumors. Font size is relative to upregulation frequency. (C) Relative upregulation frequency of glycoyltic and OXPHOS-associated genes with a dominantly glycolysis-dependent metabolism in EP300 high tumors and an OXPHOS-dependent metabolism in EP300 low tumors. ** p < 0.01, ***p < 0.0001.

