Figure 5.
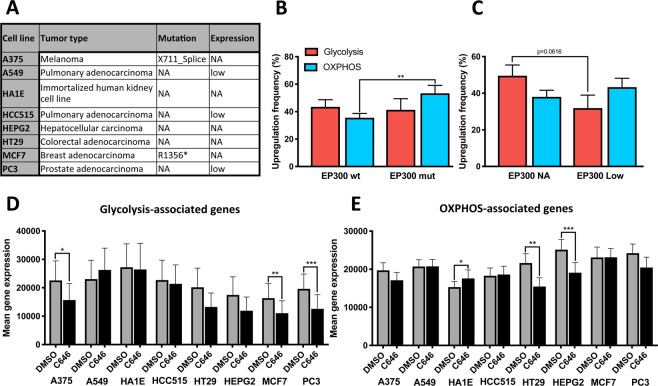
Metabolic effects of EP300 inhibition on eight cell lines via in silico analysis. (A) List of cell lines with EP300 mutation and expression status (z Score = 1). (B,C) Baseline metabolic characterization with signifcant upregulation of genes involved in OXPHOS in cell lines with EP300 mutation (A375, MCF7) and trends towards a decrease of genes involved in glycolysis in cell lines with low EP300 expression (A549, HCC515, PC3). (D–E) Changes of mean gene expression levels after treatment with the EP300 inhibitor C646 with a significant downregulation of glycolysis-associated genes (mean expression level of 52 genes) in A375, MCF7 and PC3 as well as a significant downregulation of OXPHOS-associated genes (mean expression level of 112 genes) in HT29 and HEPG2. In HAE1E OXPHOS genes significantly increased after C646 treatment. NA: No alteration; wt: wildtype; mut: mutated. *p < 0.05, **p < 0.01, ***p < 0.001.

