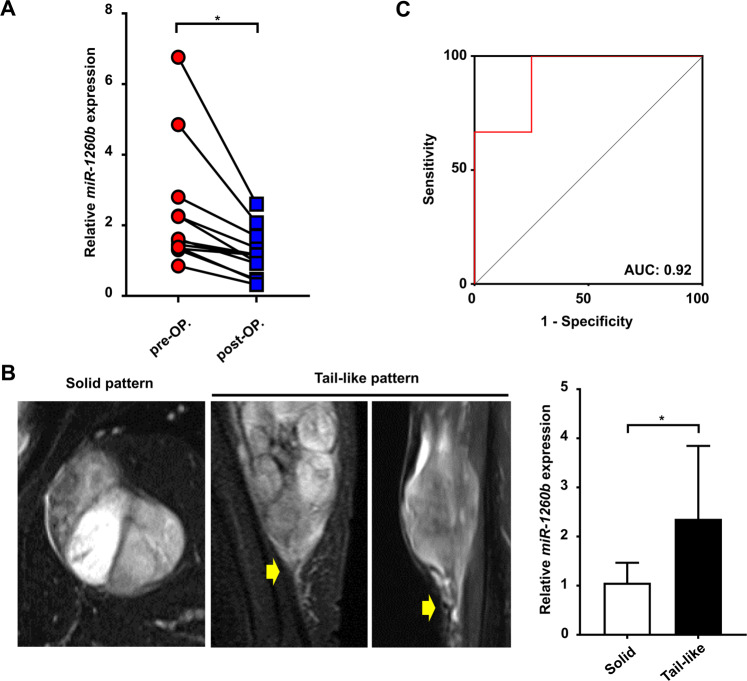
Figure 2.
Clinicopathological relevance of serum miR-1260b in MFS patients. (A) Serum miR-1260b expression levels in pre- and postoperative states. *p < 0.05; Wilcox signed-rank test. (B) Gd-T1WI MR imaging patterns of MFS. Left, solid pattern; center, tail-like pattern; right, serum miR-1260b levels in patients with/without tail-like pattern (n = 4, solid pattern; n = 6, tail-like pattern). *p < 0.05; Mann-Whitney U-test. (C) Receiver operating characteristic (ROC) curve analysis. ROC curve analysis indicated an AUC of 0.92 (95% confidence interval; 0.73–1.11) distinguishing patients with solid pattern from those with tail-like pattern.

