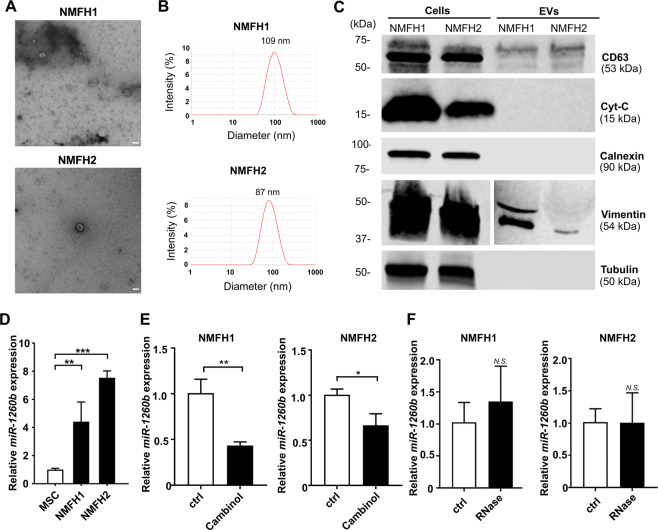
Figure 3.
Extracellular miR-1260b embedded on MFS-derived EVs. (A) Negative stain transmission electron microscopy (TEM) image of MFS cell lines (NMFH-1 and NMFH-2)-derived EVs. The image shows small vesicles approximately 100–150 nm in diameter. Scale bar =100 nm. (B) Representative dynamic light scattering analysis of EVs obtained from NMFH-1 and NMFH-2. The graph reports the diameter (nm) of the particles (x-axis) versus intensity (Optical Density y-axis). Numbers on graphs are the EV average sizes of NMFH-1 and NMFH-2. The isolated EVs ranged in size peak of 109 nm and 87 nm. (C) Western blot analysis on purified EVs derived from NMFH-1 and NMFH-2 and parental cellular lysates. CD63, a conventional EV marker. Cytochrome-C (Cyt-C), a mitochondrial marker. Calnexin, an endoplasmic reticulum (ER) marker. Vimentin, a mesenchymal marker. Tubulin as internal control for Western blot analysis. Full-length blots are presented in Supplementary Fig. 3. (D) EV-miR-1260b levels normalized to cel-miR-39 in MFS cells and hMSCs. Data are mean ± S.D. (n = 3 in each group) **p < 0.01, ***p < 0.001; Student’s t test. (E) EV-miR-1260b levels normalized to cel-miR-39 in MFS cells treated with the presence of absence of cambinol (48 hours). Data are mean ± S.D. (n = 3 in each group). *p < 0.05, **p < 0.01; Student’s t test. (F) EV-miR-1260b levels normalized to cel-miR-39 in MFS cells treated with the presence of absence of RNase. Data are mean ± S.D. (n = 3 in each group). N.S., not significant; Student’s t test.

