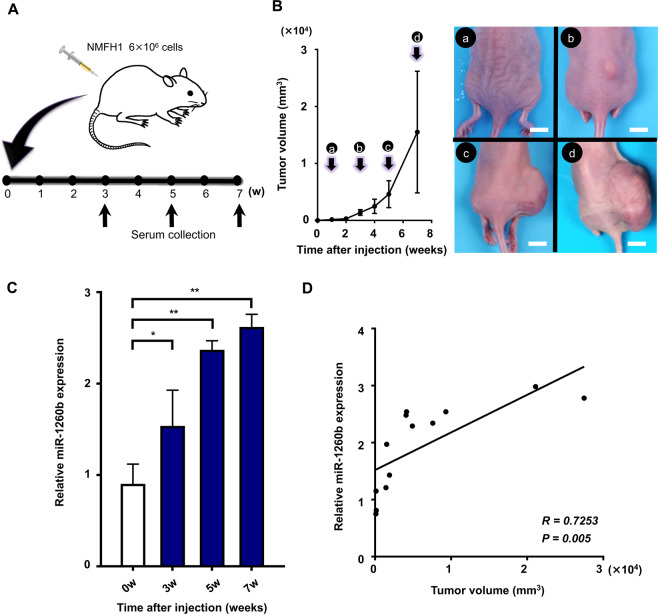
Figure 6.
Serum miR-1260b levels in MFS-bearing mice. (A) Schema of the animal experiments. (B) Tumor volumes were measured each week after MFS cell injection (left). The image shows tumor growth at one (a), three (b), five (c) and seven (d) weeks after inoculation (right). Scale bar = 10 mm. (C) Serum miR-1260b levels at indicated time points. *p < 0.05, **p < 0.01; Student’s t test. (D) Pearson’s correlation between serum miR-1260b expression levels and tumor volume (R = 0.7253, p = 0.005).

