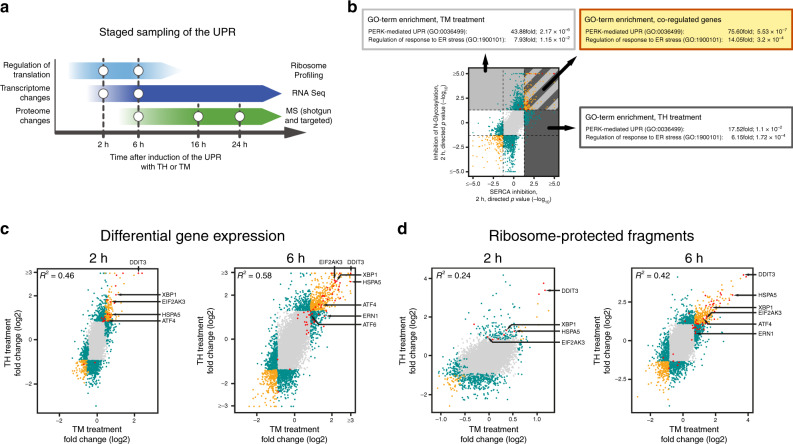
Fig. 1. A multi-omics approach to analyze the UPR.
a Schematic depiction of the staged sampling scheme employed in this study. b Comparison of TM- and TH-induced changes to RNA expression levels highly enriches for factors involved in the UPR. Plotted are directional P-values of differentially expressed protein-coding genes after 2 h of treatment. Enrichment scores and P-values for the GO-terms PERK-mediated UPR (GO:0036499) and regulation of response to ER stress (GO:1900101) are given for genes that are upregulated after (1) inhibition of N-glycosylation (by TM treatment, area shaded in light gray) (2) after inhibition of the SERCA (by TH treatment, area shaded in dark gray) and (3) upregulated in both treatments (striated area). c Comparison of differences in mRNA abundance of protein-coding genes induced by treatment with TM or TH for 2 h (left panel) and 6 h (right panel) (see also Supplementary Fig. 2 and Supplementary Data 2). d Comparison of TM- and TH-induced changes to ribosome-protected fragment counts after 2 h (left panel) and 6 h of treatment (right panel) (see also Supplementary Fig. 4 and Supplementary Data 3). In c, d log2-fold changes of mean values are plotted. Two criteria were used to identify regulated genes: (a) fold-change in the 5% (downregulation) and 95% (upregulation) quantiles and (b) a P-value threshold (<0.05). Color coding b–d—gray dots: no significant change in either treatment; green dots: significantly upregulated or downregulated in only one treatment or inversely regulated upon TM and TH treatment; yellow dots: statistically significant regulation in the same direction in both treatments; red dots: known factors of the UPR. Select factors involved in the UPR are marked by arrows.

