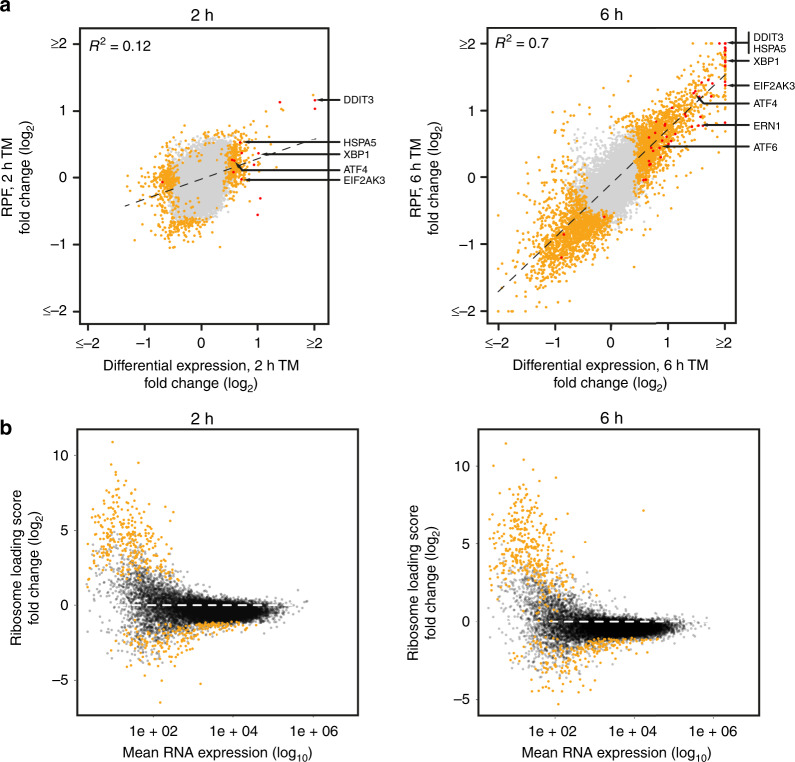
Fig. 2. Global analysis of UPR-mediated translation regulation.
a Comparison of differential RNA expression and changes to RPF abundance of protein-coding RNAs after 2 h (left panel) or 6 h (right panel) of TM treatment. Loci with a P-value below threshold are depicted yellow, plotted are log2-fold changes of mean values. b Analyses of ribosome loading scores of protein-coding RNAs after 2 h (left panel) and 6 h (right panel) of TM stimulation. Note the overall reduction in ribosome loading (for reference the dashed line indicates no change in ribosome loading). RNAs that exhibit statistically significant changes in ribosome loading are shown in yellow.

