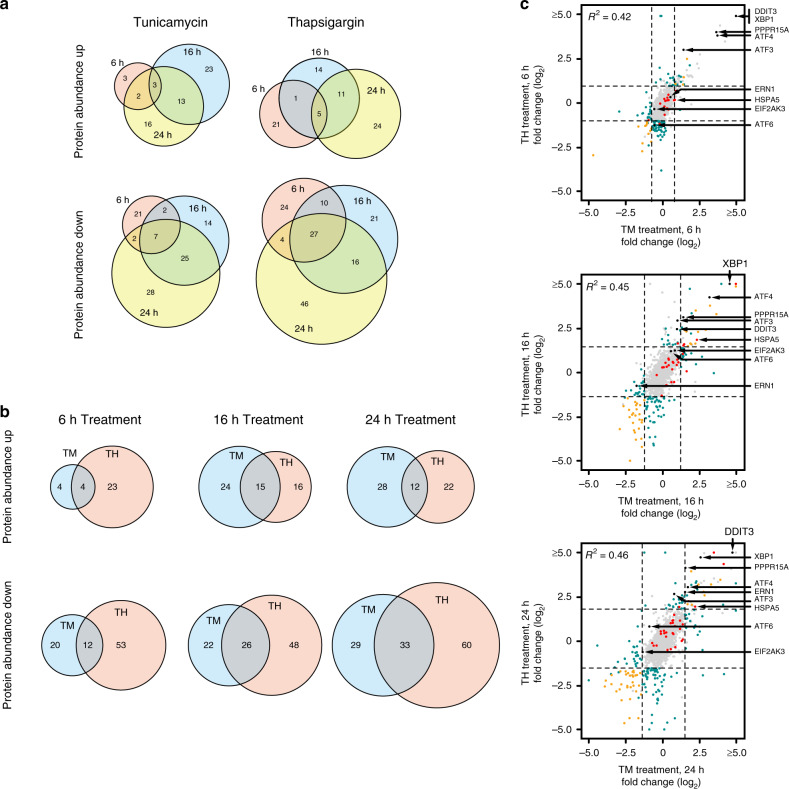
Fig. 3. UPR-induced changes to the cellular proteome.
a Time-resolved comparison of changes to protein abundance after TM treatment (left) or TH treatment (right). b Comparison of TM and TH-induced changes to protein abundance after 6, 16, and 24 h of treatment. c Comparison of mean values of protein abundance changes 6 h (top panel), 16 h (middle panel), and 24 h (bottom panel) after stimulation with either TH or TM. Data from shotgun proteomics are color-coded as in Fig. 1. Additional data points from a targeted proteomics approach30 are shown as black dots. Select proteins involved in the UPR are marked by arrows. (see also Supplementary Fig. 5 and Supplementary Data 4). Two criteria were used to filter for regulated genes: a fold-change median ± 2 * standard deviation (as indicated by the dashed lines), and a P-value threshold (<0.05).

