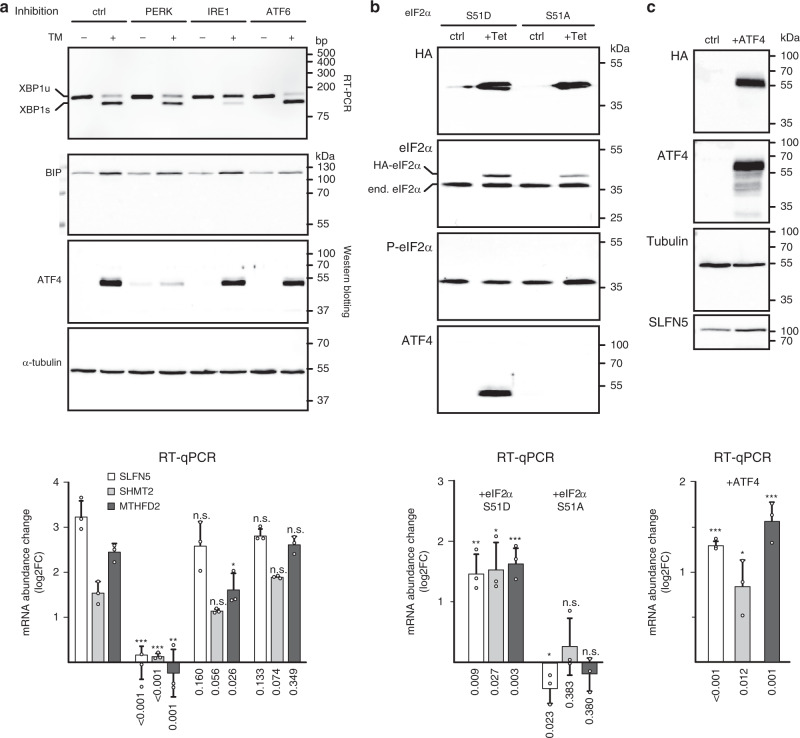
Fig. 4. SLFN5, SHMT2, and MTHFD2 are induced by the UPR via the PERK–EIF2S1–ATF4 pathway.
a Gene expression analysis of SLFN5, SHMT2, and MTHFD2 mRNAs after activation of the UPR in LN-308 cells. In parallel to stimulation with TM (lanes denoted +), either PERK, IRE1, or ATF6 were inhibited with small molecules (as indicated at the top). DMSO treatment served as a control. After 6 h, changes to gene expression were monitored. Top panel: RT-PCR analysis of IRE1-mediated cytoplasmic processing of XBP1 mRNA. Middle panels: Western blotting analyses of BiP (HSPA5), ATF4 and α-tubulin protein levels. Bottom: analysis of SLFN5 (white bars), SHMT2 (light gray bars) and MTHFD2 (dark gray bars) mRNA abundance by RT-qPCR. Plotted are mRNA abundance changes (log2 FC) relative to the control treatment and normalized to GAPDH mRNA levels. b Expression analysis of SLFN5, SHMT2, and MTHFD2 mRNA abundance in HEK293 cells after expression of a phosphomimetic eIF2a protein (lanes S51D), or a non-phosphorylatable variant (lanes S51A). After 24 h of induction (lanes + Tet), expression of the mutant proteins is monitored relative to control samples (ctrl). Top panels: Western blotting analyses with antibodies that recognize either the HA-tag of the stably transfected eIF2a protein-encoding constructs (top panel), total eIF2α (second panel), S51 phosphorylated eIF2α (third panel), or ATF4. Bottom: analyses of mRNA abundance as described for a. c Expression analysis of SLFN5, SHMT2, and MTHFD2 mRNA abundance in LN-308 cells after transient expression of ATF4. Western blotting analyses of protein expression using antibodies specific for the HA-tag of the transfected construct, ATF4, tubulin, or SLFN5. Bottom: RT-qPCR analysis as described for a. Experiments were performed in at least three biologically independent experiments, representative blots/gels are shown (uncropped images are provided in the supplementary information). Molecular weight markers (in kDa) or DNA size markers are indicated on the right of each panel. qPCR data are represented as mean ± SD of three biologically independent experiments measured in technical triplicates (dots represent average values of three technical replicates). P-values are provided below each bar, n.s. not significant P > 0.05; *P < 0.05, **P < 0.05, ***P < 0.01 as determined by a Student’s t-test (two-sided, true variance equality, confidence level 0.95, no adjustment for multiple comparisons).

