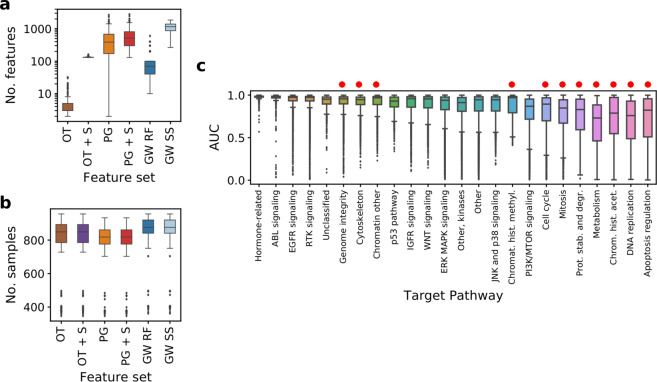
Figure 2.
Models’ properties and response variable grouped by target pathways. (a) Number of input features across compounds in different methods. For genome-wide models, number of features was 17737 for each drug. Vertical axis uses log scale. (b) Number of samples across compounds in different methods. Abbreviation SS refers to stability selection (Methods). (c) AUC values grouped by target pathway of the drug, raw data from GDSC. Target pathways are sorted by interquartile range of the AUC values. Pathways corresponding to more general cell mechanisms are marked with red dots. See Fig. 1 for abbreviations.

