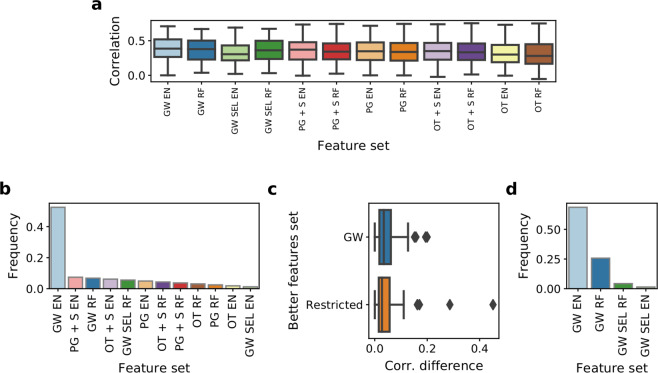
Figure 4.
Frequencies of all applied methods among best models per drug. (a) Correlation of AUC predictions with the true AUC values in the test set across compounds in methods with different feature spaces. Results are shown for 175 drugs which were common across all applied models. (b) Model frequencies for compounds for which all methods were applied. (c) Differences in correlation between best model per drug overall and best model from the other class. Two cases are shown – genome-wide and biologically driven feature sets. (d) Model frequencies among best models for compounds where models with biologically driven could not have been applied. See Fig. 1 for abbreviations.

