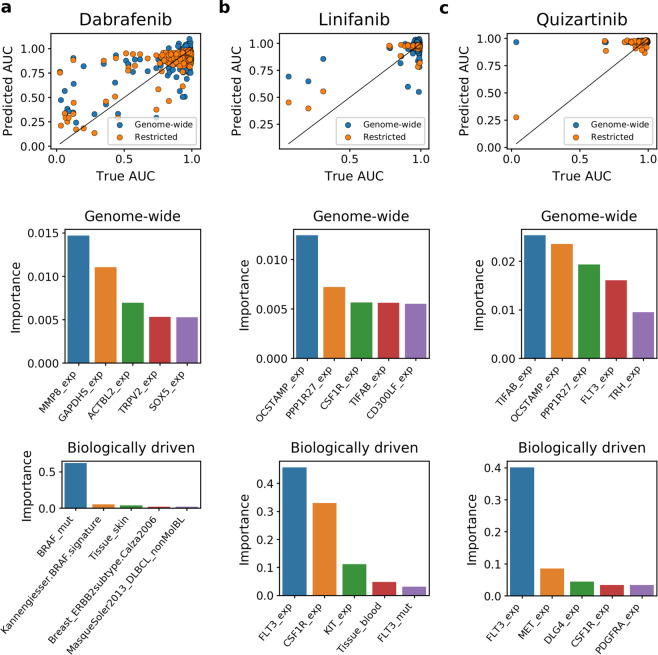
Figure 8.
Predicted versus actual AUC values and most predictive features for (a) Dabrafenib, (b) Linifanib and (c) Quizartinib. Top panels show predicted versus actual AUC values when both biologically driven and genome-wide models were trained and tested on the same sets of samples. The biologically driven models correspond to best suited feature set for each drug: OT + S RF for Dabrafenib, OT RF for Linifanib and PG RF for Quizartinib. Middle and bottom panels present top 5 most informative features when fitting the model with genome-wide data (middle) and biologically driven feature space (bottom).

