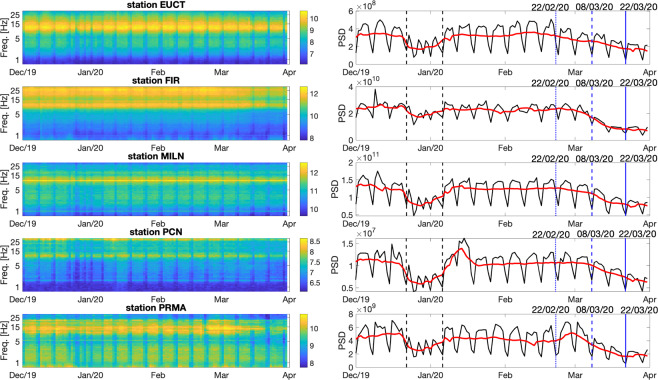
Figure 3.
Spectrograms (left) of signal recorded on the vertical components of stations (top to bottom) EUCT, FIR, MILN, PCN, PRMA. To the right, curves obtained from the same spectra, by averaging over the entire frequency range of interest (1 to 40 Hz), without (black line) and with (red) smoothing, similar to Fig. 2. The dates of mentioned governmental decrees are highlighted as in Fig. 2, and so are the typical initial and final days of winter break.

