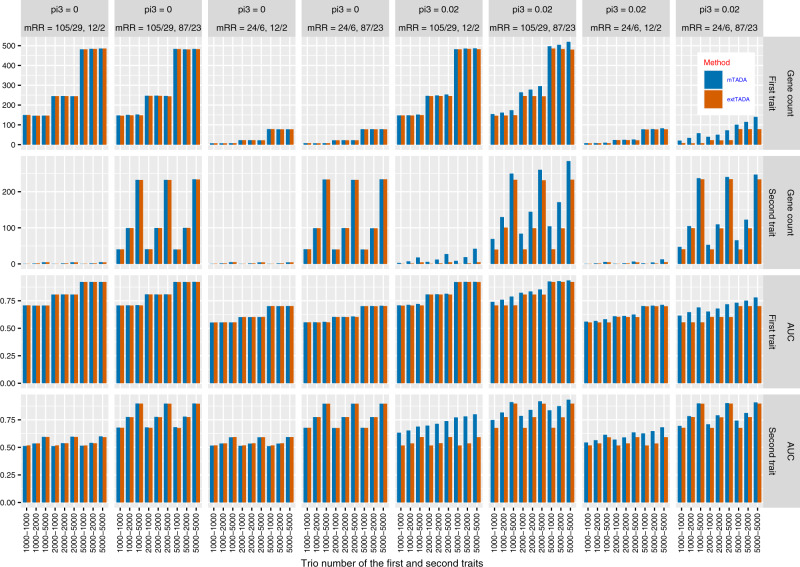
Fig. 2. Comparison results of simulated data for the current multi-trait approach (mTADA) and a previous single-trait approach (extTADA) in single-trait analyses.
For each bar, its height shows the average value of 100 simulations. mTADA performs better than extTADA when the proportions of overlapping risk genes (pi3) are larger than zero. The top two lines describe gene counts (posterior probability >0.8, while the two bottom lines show area under the Receiver Operating Characteristic (ROC) curves (AUCs). mRR describes mean relative risks and the trio number along the bottom describes the sample sizes. These results are for two variant categories. For example, “mRR = 105/29, 12/2” describes the mRRs of the first trait as 105 and 29, and the mRRs of the second trait as 12 and 2.

