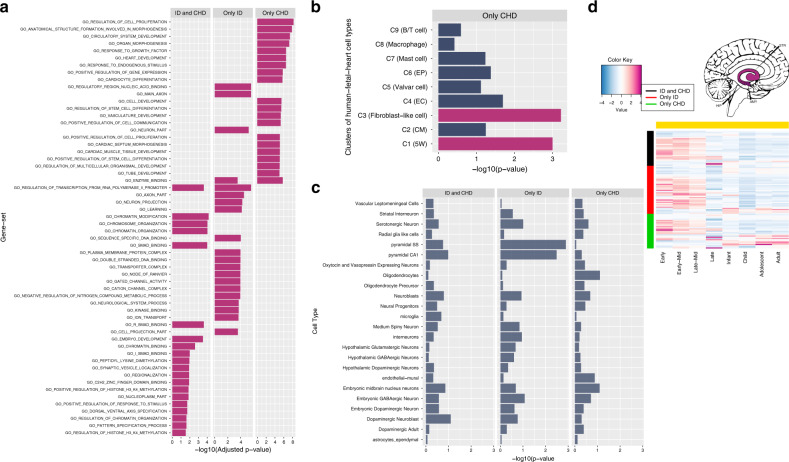
Fig. 6. The analysis results of shared and specific gene lists for ID and CHD (Only CHD: CHD-specific genes, Only ID: ID-specific genes, ID and CHD: shared genes).
a Top enrichment results of gene-ontology (G0) gene sets. These are the top 20 enriched gene sets of each gene list. All these results have adjusted-p-value < 0.05. b Enrichment results of human single-cell RNA sequencing (scRNAseq) datasets. These cells are from cardiac cells of the human fetal heart. They were clustered into 9 clusters (e.g., C1 to C9). The information of these clusters is in brackets (5W: 5-week hearts, ECs: endothelial cells, CMs: cardiomyocytes, epicardial cells: Eps). Magma-red bars are for results with adjusted p-value < 0.05 c) Enrichment results of mouse scRNAseq expression data. d BrainSpan expression results for the three gene lists. This is for Region 3 as defined by Huckins, et al.34 including hippocampus (HIP), amygdala (AMY), striatum (STR) regions. The package cerebroViz67 was used to draw brain regions.

