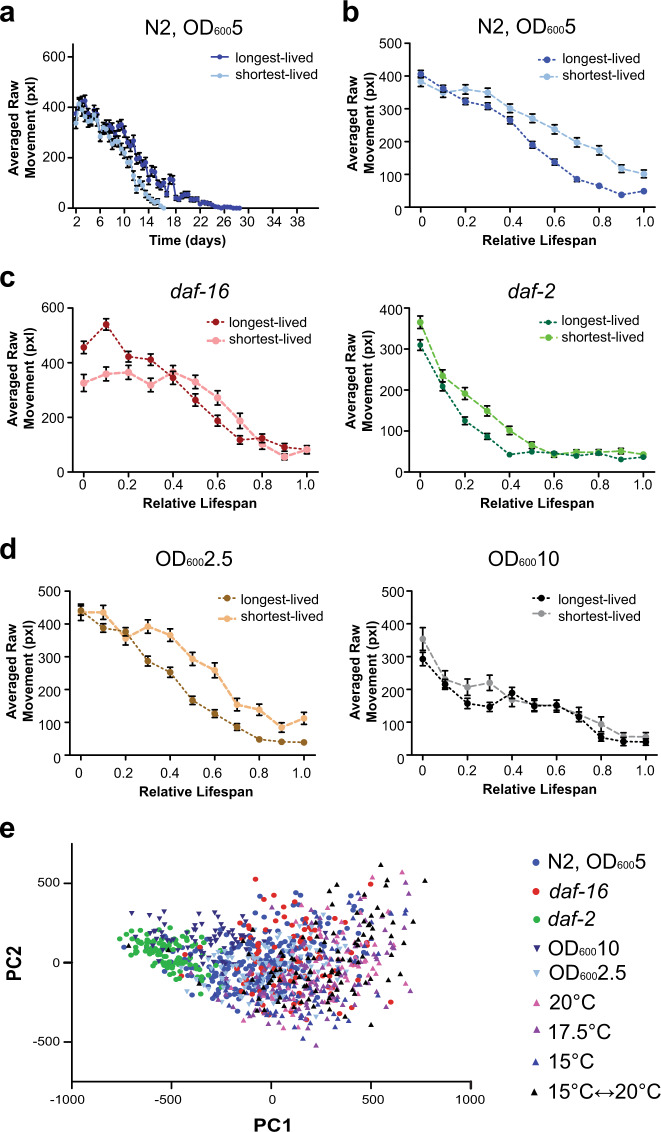
Fig. 6. Intrapopulation variation across genetic and environmental perturbations.
a Averaged raw movement over time of the short- (n = 62 biologically independent animals) and long-lived (n = 55 biologically independent animals) subpopulations within the wild-type population culture at 25 °C at OD6005 food level. Error bars are SEM. b Averaged raw movement over normalized relative lifespan of short- and long-lived WT populations cultured at 25 °C at OD6005 food level. Error bars are SEM. c Averaged raw movement over the normalized, relative lifespan of the short- and long-lived subpopulations across daf-16 (shortest-lived: n = 23 biologically independent animals, longest-lived: n = 21 biologically independent animals) and daf-2 (shortest-lived: n = 22 biologically independent animals, longest-lived: n = 23 biologically independent animals) populations at 25 °C at OD6005 food level. Error bars are SEM. d Averaged raw movement over the normalized, relative lifespan of the short- and long-lived WT subpopulations cultured at 25 °C on OD6002.5 (shortest-lived: n = 45 biologically independent animals, longest-lived: n = 37 biologically independent animals) and OD60010 (shortest-lived: n = 22 biologically independent animals, longest-lived: n = 26 biologically independent animals) food levels. Error bars are SEM. d All individuals (n = 981 biologically independent animals) plotted in a shared principle component space.

