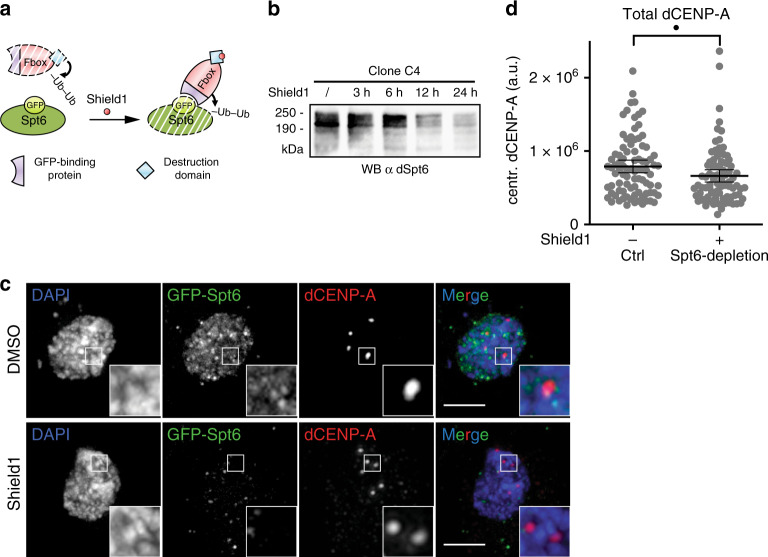
Fig. 2. Spt6 depletion results in lower levels of total dCENP-A.
a Schematic representation of the Shield1-induceable degradation of GFP-Spt6. b Western blot analysis demonstrating the depletion of GFP-tagged Spt6 following the addition of Shield1. N = 3 independent experiments. c Maximum intensity projection of representative cells for the analysis in (d). Cells treated for 21 h with DMSO (upper panel) or Shield1 (lower panel) are shown. Boxes indicate the 3× enlarged inset. Scale bar represents 3 µm. d Quantification of total centromeric dCENP-A levels in Spt6 WT or depleted cells (17% reduction). N = 4 independent experiments; nWT = 87, ndepl = 85 cells. Data are represented as scatter plots with mean and 95% confidence interval (CI). Statistical significance: single dot P = 0.0157 (unpaired, two-tailed Mann–Whitney test). Source data are provided as a Source Data file.

