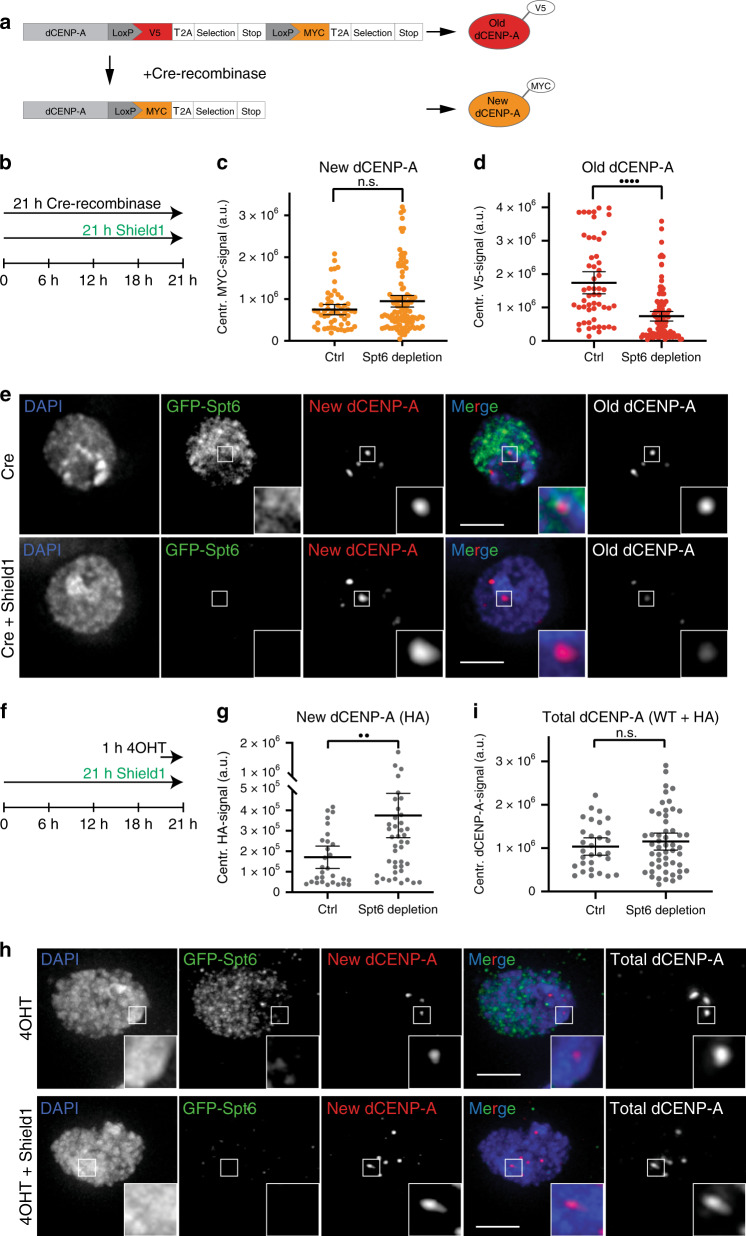
Fig. 3. Parental dCENP-A is lost in Spt6-depleted cells.
a Scheme displaying the RITE system used to distinguish old and new protein simultaneously (adapted from Verzijlbergen et al.55). b Experimental setup used in (c–e). Quantification of the centromeric incorporation of new dCENP-AMYC (c) or remaining levels of old dCENP-AV5 (d) at centromeres under Spt6 depletion conditions (58% reduction). N = 3 independent experiments; nWT = 54, ndepl = 107 cells. Statistical significance: quadruple dots P < 0.0001; n.s. not significant (unpaired, two-tailed Mann–Whitney test). e Maximum intensity projection of representative cells measured in c, d. Cells treated with Cre recombinase (upper panel) or Cre recombinase plus Shield1 (lower panel) are shown. Boxes indicate the 4× enlarged inset. Scale bar represents 3 µm. f Experimental setup used in (g–i). g Quantification of new centromeric dCENP-AHA in fixed cells following 4OHT mediated release of TI-dCENP-AHA and depletion of Spt6 through Shield1 treatment. N = 3 independent experiments, nWT = 30, ndepl = 47 cells. Data are represented as scatter plots with mean and 95% CI. h Maximum intensity projection of representative cells measured in g, i. 4OHT treated (upper panel) and 4OHT plus Shield1 treated cells (lower panel) are shown. Boxes indicate the 4× enlarged inset. Scale bar represents 3 µm. i Quantification of total centromeric dCENP-A in fixed cells following 4OHT mediated release of TI-dCENP-AHA and depletion of Spt6 through Shield1 treatment. N = 3 independent experiments, nWT = 30, ndepl = 52 cells. All data plots are represented as scatter plots with mean and 95% CI. Statistical significance: double dots P = 0.0025; n.s. not significant (unpaired, two-tailed Mann–Whitney test). Source data are provided as a Source Data file.

