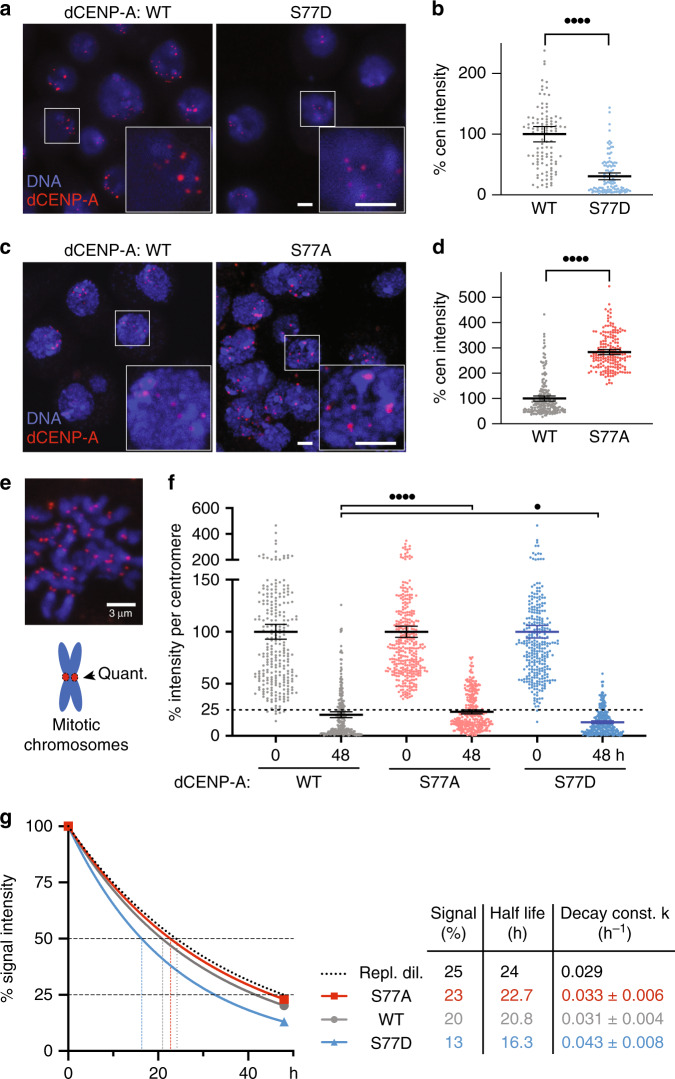
Fig. 5. dCENP-A abundance at the centromere is affected by phosphorylation.
a Stably transfected cells with SNAP-tagged wildtype (WT) or S77D mutant dCENP-A were visualized by staining with TMR Star. Boxes indicate the 2.5 times enlarged inset. b Quantification of centromeric signal intensities of wildtype (n = 196) and S77A CENP-A (n = 182 centromeres). Representative images (a) and quantification (b) of one out of N = 3 independent experiments are shown. c SNAP-tagged wildtype and S77A-mutant dCENP-A staining by TMR Star. d Quantification of centromeric signal intensities of wildtype (n = 110) and S77D CENP-A (n = 112). Representative images (c) and quantification (d) of one out of N = 5 independent experiments. Values are normalized relative to the wildtype mean (set to 100%). Data are represented as scatter plots with mean and 95% CI. Statistical significance: quadruple dots P < 0.0001 (unpaired, two-tailed Mann–Whitney test). e Example image of a mitotic chromosome spread (wildtype) and cartoon illustrating analysis shown in (f). f Quantification of total TMR signal intensities per centromere (representative images shown in Supplementary Fig. 4), nWT 0|48h = 284|251, nS77A 0|48h = 368|305, nS77D 0|48 = 315|261 is shown for one out of N = 3 independent experiments. Mean values for the 0 h time point was set to 100% for each cell line. The dashed line marks 25%, the signal intensity expected for dCENP-A undergoing only replicative dilution after two cell generations (48 h). Data are represented as scatter plots with mean and 95% CI. Statistical significance: quadruple dots P < 0.0001, single dots P = 0.0221 (unpaired, two-tailed Mann–Whitney test). g Non-linear regression curves illustrating the decrease of centromeric CENP-A signal over 48 h. Half-life and decay constant k (± upper and lower 95% CI) were calculated using the one-phase-decay function of Prism 8.4.0. Source data are provided as a Source Data file.

