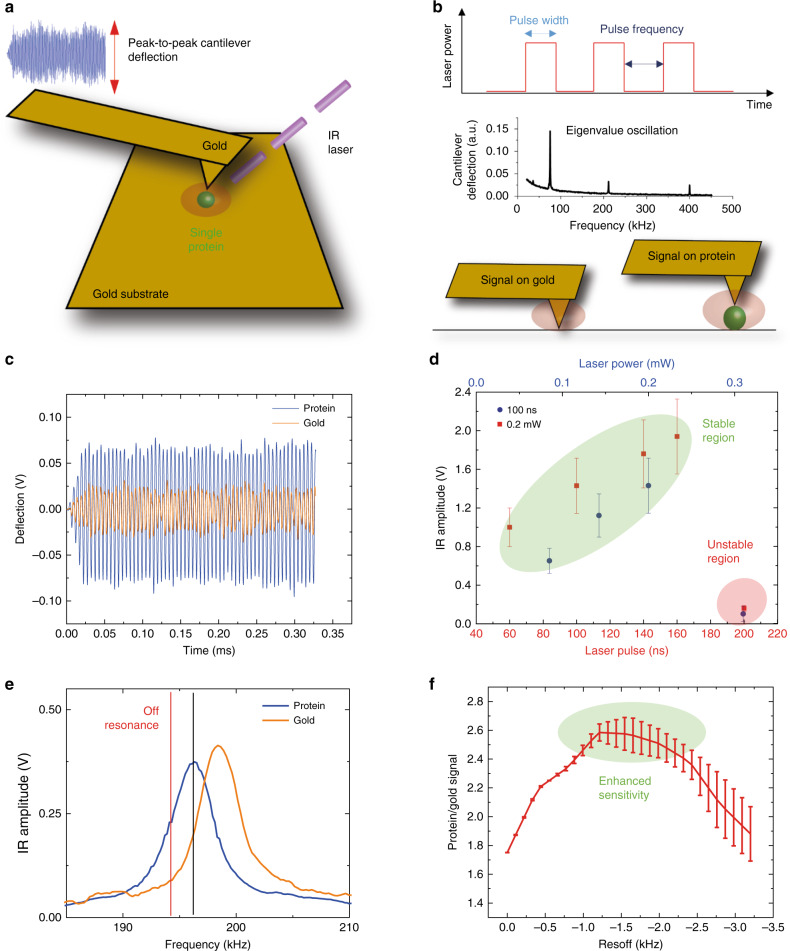
Fig. 1. Off resonance, short pulse, low power infrared (ORS-nanoIR) absorption spectroscopy of single protein molecules.
a Scheme of the experimental setup, exploiting the rod-like antenna effect at the nanogap between a gold substrate and a gold cantilever. b Scheme of the pulsed excitation of the laser (top), of the eigenvalues of oscillation of the cantilever (centre) and of the laser hot spot on gold and on a protein (bottom). c Measurement of the cantilever deflection on gold and on a thyroglobulin molecule at a frequency of 194 kHz, power of 0.22 mW and at 1655 cm−1. d IR amplitude of the cantilever response on the bare gold substrate as a function of laser power and pulse at 1730 cm−1; low values define the region of stability of the thermomechanical response (green circle) and high values can cause instabilities and drop of the signal (red circle). e IR amplitude as a function of frequency pulse for signal on gold and on a thyroglobulin molecule at a laser power of 0.22 mW and at 1655 cm−1. f Plot of the ratio between the IR amplitude of the signal on the protein and on the gold as a function of frequency. Since the tip interacts both with gold and protein, the maximum sensitivity in detecting the signal of the protein vs. the signal of gold (green circle) occurs for a laser frequency off resonance (red line) of the maximum of the response on the protein molecule (black line). In all panels, the error bars represent the average + s.d. Source data are provided as a Source Data file.

