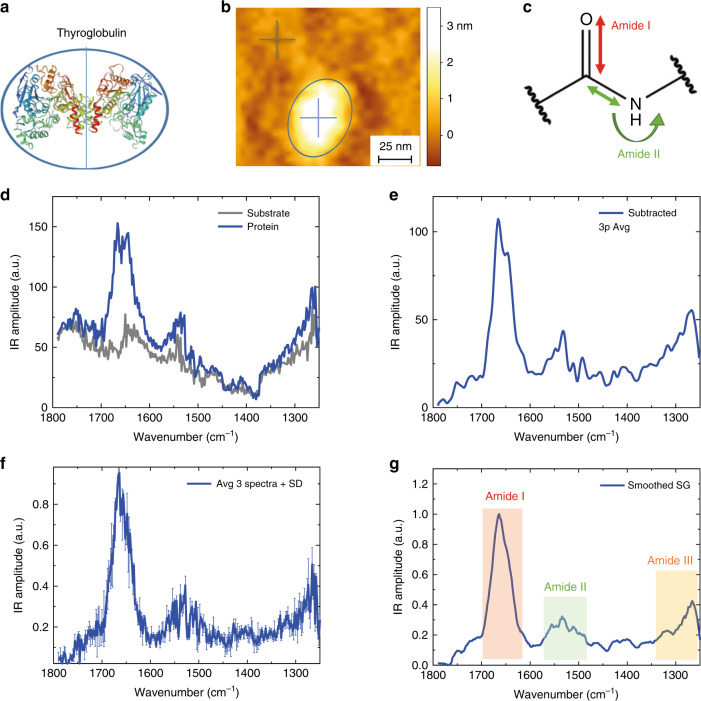
Fig. 3. ORS-nanoIR absorption spectra of single protein molecules.
a Thyroglobulin structure29. b Morphology map of a single protein (blue circle). c Schematic of the chemical bond vibration leading to the amide band I (80% C = O stretching, 10% C–N stretching; 10% N–H bending), amide band II (60% N–H bending and 40% C–N stretching)19. d IR absorption spectra acquired on the protein (blue cross), on gold (grey cross) (laser power: 0.3 mW; pulse: 60 ns). e Protein–substrate subtraction spectrum with adjacent averaging of three points. f Average of three different subtracted spectra on the same protein with standard error. g Savitzky–Golay smoothed (second order, 13 pt) and baselined spectrum in amide bands I, II, III. The error bars represent the average + s.d. Source data are provided as a Source Data file.

