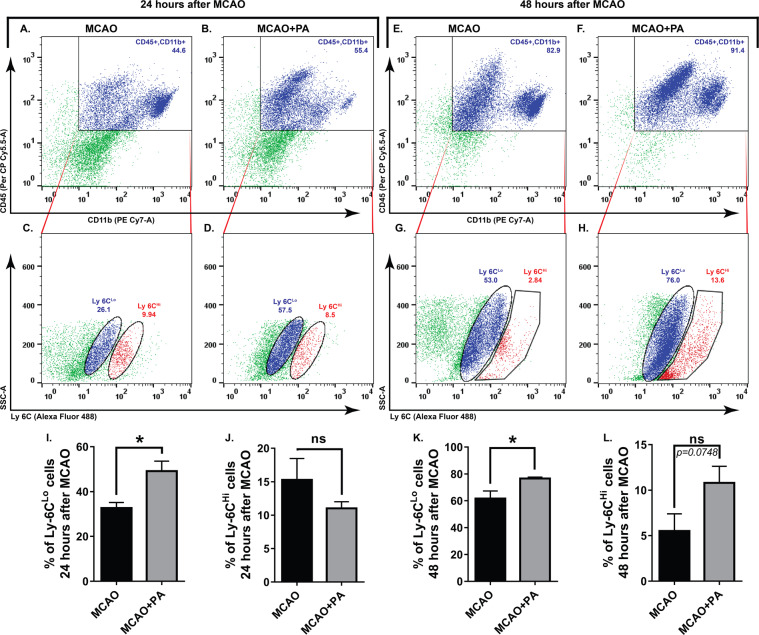
Figure 5.
Characterization of infiltrated monocytes in the brain induced by pamoic acid (PA). The representative, flowcytometry diagram shows the Ly6CLo and Ly6CHi subsets of monocyte (C,D,G,H) gated from the CD45+ CD11b+ cell population (A, B, E, and F) in the ischemic hemisphere at both 24 h and 48 h after the MCAO respectively. I, J. PA treatment increased Ly-6C Lo cell population 24 h after the MCAO. *P = 0.0175, (unpaired t-test, n = 4). However, the Ly-6C Hi cell population was unaffected by PA treatment. K, L. PA treatment increased Ly-6C Lo cell population 48 h after the MCAO. *P = 0.0187, (unpaired t-test, n for MCAO = 5, n for MCAO + PA = 6). Ly-6C Hi cell population was unaffected by PA treatment at this time point.

