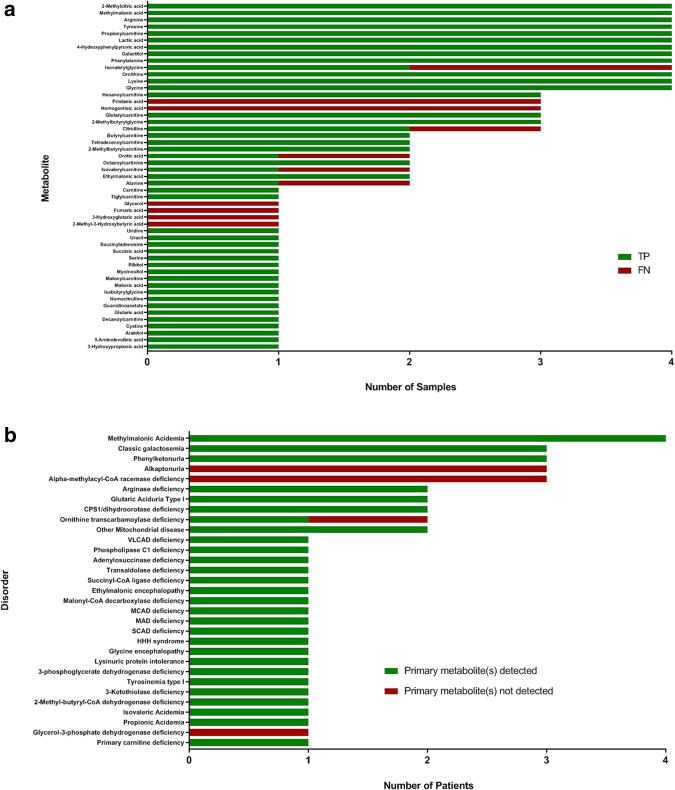
Figure 2.
Diagnostic performance of GUM in the clinical utility study. GUM was compared with TM for, (a) the ability to detect 51 diagnostic metabolites in specimens collected from 87 patients with established IEMs or genetic disorders. Y-axis represents diagnostically-relevant metabolites, and x-axis represents the number of samples (plasma, urine and CSF) in which metabolite was detected. Metabolite data was expressed as a function of true positives (TP) and false negatives (FN); (b) the ability to successfully identify patients with disorders based on the detection of the primary metabolite associated with that disorder. Disorders are presented on the y-axis, and the number of patients detected with each disorder represented on the x-axis.

