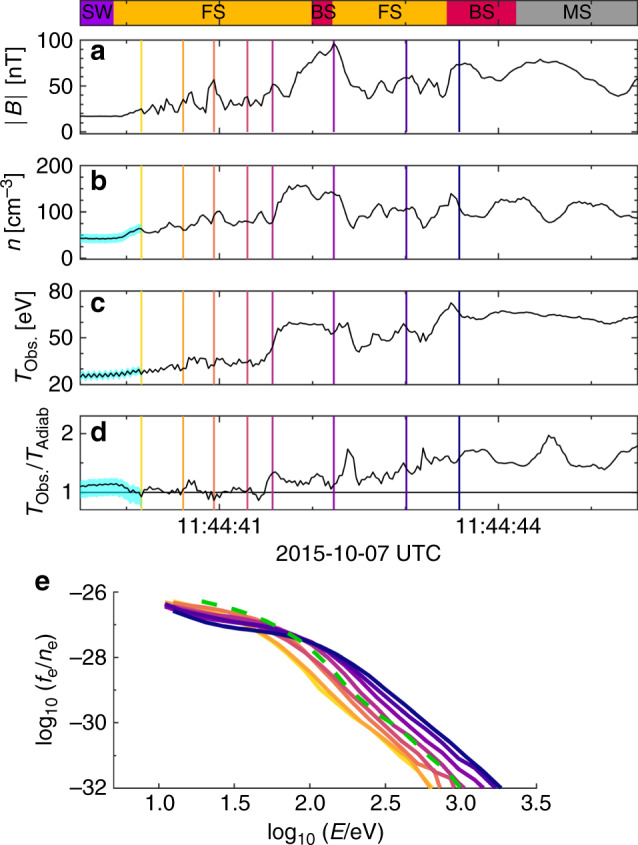
Fig. 2. MMS data for bow shock crossing.

a Plot of the average magnetic field from MMS1 as a function of time. The bar on the top of the plots denotes the part of the shock that the spacecraft is observing. The spacecraft is initially in the solar wind (SW) approaching the Earth's bow shock, then travels through the foreshock (FS) and the bow shock (BS) before entering the Earth's magnetosheath (MS). The part of the plot highlighted in light blue denotes the low density of the solar wind. This low density affects spacecraft performance, leading to uncertainty in the measurement of TObs./TAdiab. in this region. b Plot of the density from MMS1 as a function of time. c Plot of the observed temperature (TObs. = Tr(P)/(3n)) from MMS1 as a function of time. d Plot of the observed temperature as compared to the temperature expected from compressional heating alone (TAdiab. = n2/3). e Pitch-angle-averaged distributions at the times denoted by the colored lines in a–d. The green dashed line denotes what the final distribution at the last point should look like if it only underwent compressional heating from the initial yellow time point to the final blue time point. All of these time points are chosen to be near peaks of the magnetic fluctuations spaced upstream of this quasi-perpendicular shock front, θBn = 83∘, at Alfv́nic Mach number, MA = 6.327.
