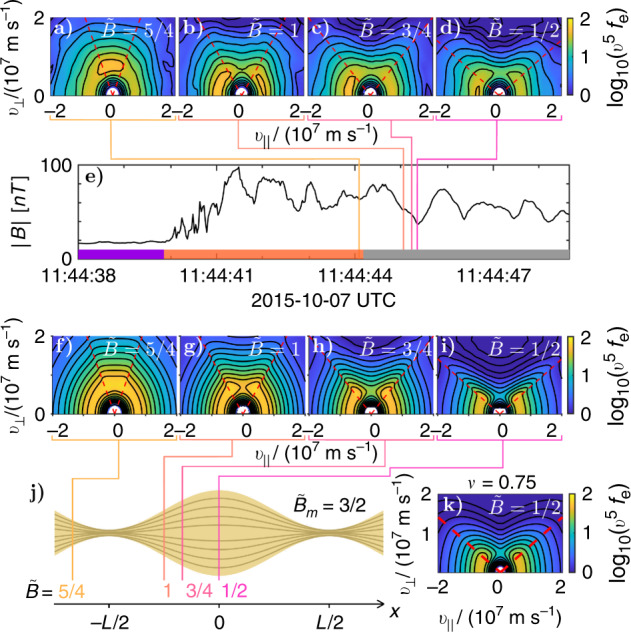
Fig. 3. Comparison of MMS observations with model.

a–d Electron distributions recorded by the Fast Plasma Investigation (FPI) instruments on MMS3 at 30 ms resolution for the rippled foreshock event reported in ref. 27, for the estimated points along the fluctuation where . The distributions are weighted by the factor v5 to visually enhance the anisotropic features. The trapped-passing boundary is denoted by a red dashed line. e Magnetic-field strength along the foreshock encounter, where the colored lines denote the times where the distributions in a–d were taken. The purple bar on the bottom denotes the part of the observation that is in the solar wind, followed by an orange bar that denotes the foreshock and bow shock, then a gray bar for the part of the observation that is in the magnetosheath. f–i Expected distribution functions computed using Eq. (3) integrated at . The distributions are evaluated at the same inferred from the MMS data in a–d. In this comparison we have assumed the Taylor hypothesis35, that the changes in B recorded by the spacecraft are mainly caused by the spatial, not temporal, variations. For all electron distributions, the red dashed lines indicate the trapped/passing boundaries, characterized by . Electrons with (v∥, v⊥) in the vicinity of these boundaries follow orbits which stagnate (v∥ ≃ 0) where ∂B/∂t is maximal, causing the orbit average of to be positive. This explains the enhanced values of f along the trapped-passing boundaries. j shows a cartoon version of the flux tube. k shows the theoretical distribution in i scattered with the Lorentz operator, , for ν/(ω/2π) = 0.75.
