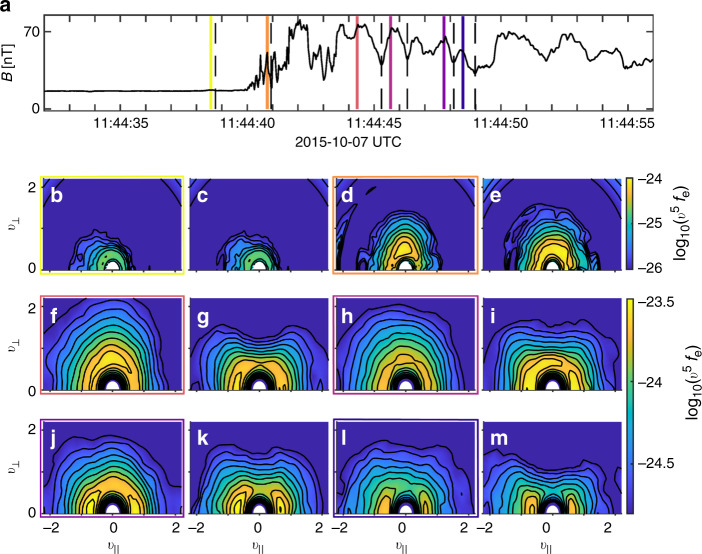
Fig. 7. Distributions along the bow shock crossing.
a Magnetic field observed by MMS4 along the bow shock crossing. b–m Electron distribution functions at the peaks and the corresponding valleys of magnetic fluctuations along the bow shock crossing are plotted. The distributions with the colored borders are the distributions taken at the magnetic peaks at the times denoted by the colored lines in a. The adjacent distributions are taken at the associated valleys denoted by the adjacent dashed lines in a.

