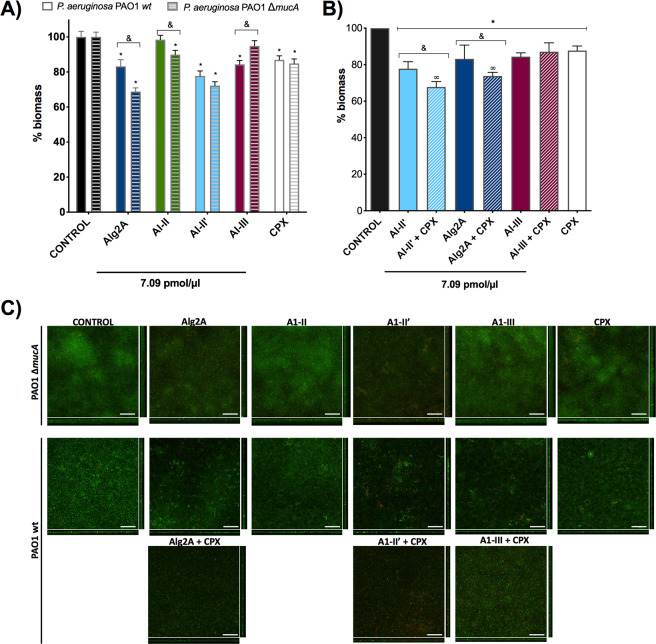
Figure 4.
Biofilm degradation activity. (A) The histogram shows the ability of different enzymes to degrade biofilms formed by P. aeruginosa PAO1 wt (solid bars) and PAO1ΔmucA (striped bars). The concentration of enzyme was the same in each sample (7.09 pmol/µl), that corresponds to 0.32 mg/ml for Alg2A; 0.14 mg/ml for A1-II; 0.22 mg/ml for A1-II’; and 0.23 mg/ml for A1-III. The values are normalized against the control sample (non-treated biofilm) that has 100% biomass. The decrease in the percentage of biomass reflects the effect of the treatment. The asterisk (*) indicates a significant difference (p < 0.05) when the sample is compared with the control. The (&) indicates a significant difference (p < 0.05) when the PAO1 wt strain is compared with PAO1ΔmucA. (B) Synergism between antibiotics and the AlyA1, A1-III and Alg2A alginate lyase proteins. The asterisk (*) indicates a significant difference (p < 0.05) when the sample is compared with the control. The (&) indicates a significant difference (p < 0.05) when alginase is compared with alginase + ciprofloxacin. The (∞) indicates a significant difference (p < 0.05) when the sample is compared with ciprofloxacin. (C) Sum of stack images and the corresponding orthogonal views of the confocal microscopy images of P. aeruginosa PAO1 wt and PAO1 ΔmucA biofilms treated with 7.09 pmol/µl of the different alginate lyases and 1 µg/ml of ciprofloxacin (CPX). Red and green colors show the P. aeruginosa dead and alive cells detected by the LIVE/DEAD staining kit, respectively. Scale bar corresponds to 50 µm.

