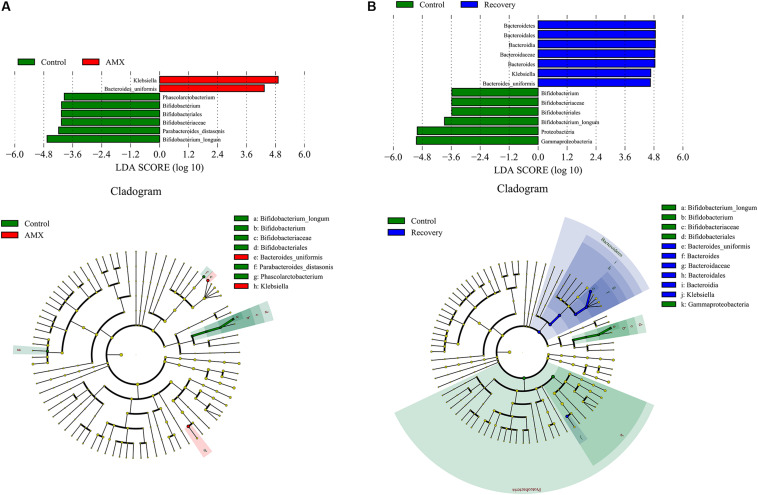
FIGURE 4.
LDA score and cladogram of LEfSe comparison analysis between the control and AMX groups (A), and between the control and recovery groups (B). The red, green, or blue shading depicts bacterial taxa that were significantly higher in either the control, AMX or recovery groups, as indicated. Selection of discriminative taxa between the control and AMX groups or between the control and recovery groups were based on an LDA score cutoff of 3.0, and differences in the relative abundances of taxa were statistically determined based on a Mann–Whitney test at a significance level of 0.05.

