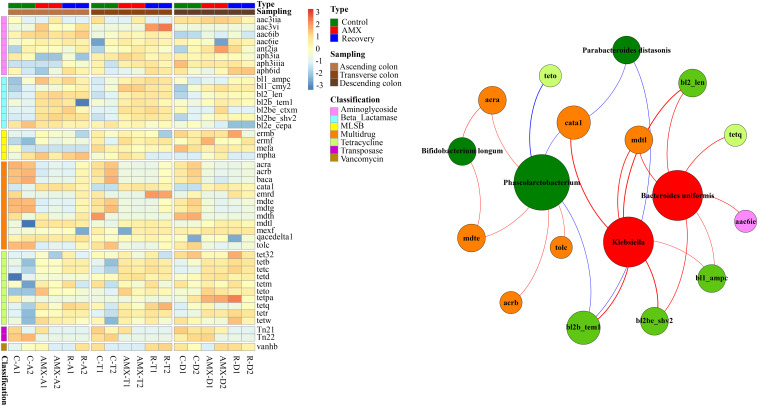
FIGURE 6.
Heatmap of antibiotic resistance genes (ARGs) in the three parts of colon within three groups and the network analysis revealing the co-occurrence patterns between abundance of microbial taxa and that of ARG subtypes. Heatmap colors reflect relative abundance from low (blue) to high (red). The nodes in network were colored according to ARG types and microbial genera that increased (red) or decreased (green) after AMX exposure, and the edges were colored according to positive (red) or negative (blue) correlation. A connection represents strong and significant (P value < 0.05, R > 0.6) correlation. The size of each node is proportional to the number of connections, that is, degree.

