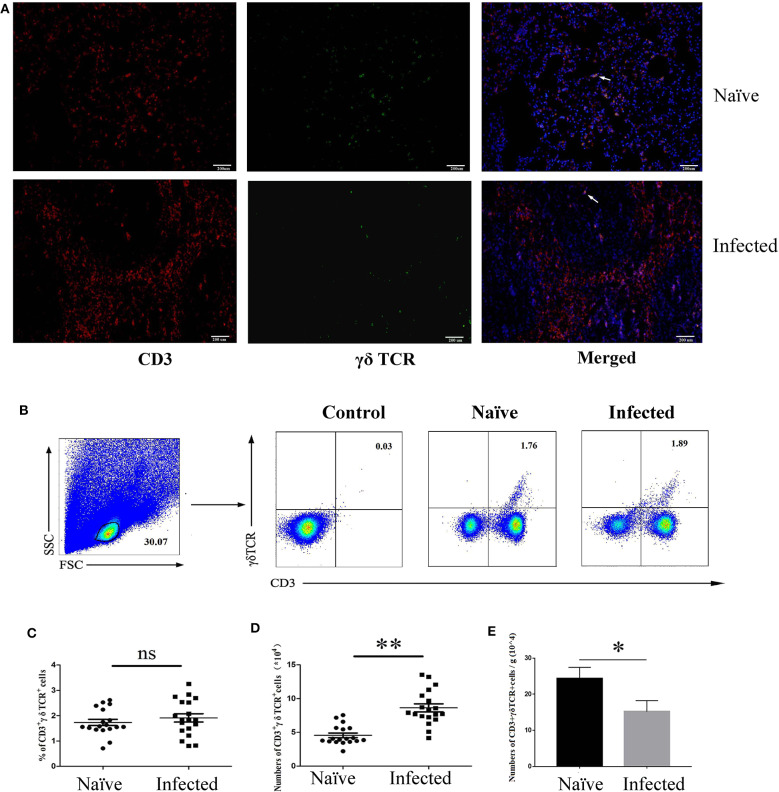
Figure 1.
Distribution and content of γδ T cells in S. japonicum-infected mouse lungs. Female C57BL/6 mice were infected with 40 ± 5 S. japonicum cercariae per mouse, and 5–6 weeks after infection, mice were euthanized. (A) Fluorescence staining was performed on paraffin sections of lung tissue from infected mice. CD3 (Red) and γδ TCR (Green) are identified by different fluorescence, and nuclei are visualized using DAPI staining (Blue). A representative experiment from three independent experiments was shown. Scale bar, 200 μm. (B) Pulmonary cells were stained with anti-CD3 and anti-γδ TCR mAbs. The percentage of CD3+γδTCR+ cells in the lungs of naïve and infected mice were analyzed by FCM. One representative experiment was shown. The percentage (C) and absolute number (D) of CD3+γδTCR+ cells per mouse, and the number of γδ T cells in per gram of lung tissues (E) were calculated from three independent experiments with 5–6 samples, respectively. **P < 0.01, *P > 0.05, ns P > 0.05.

