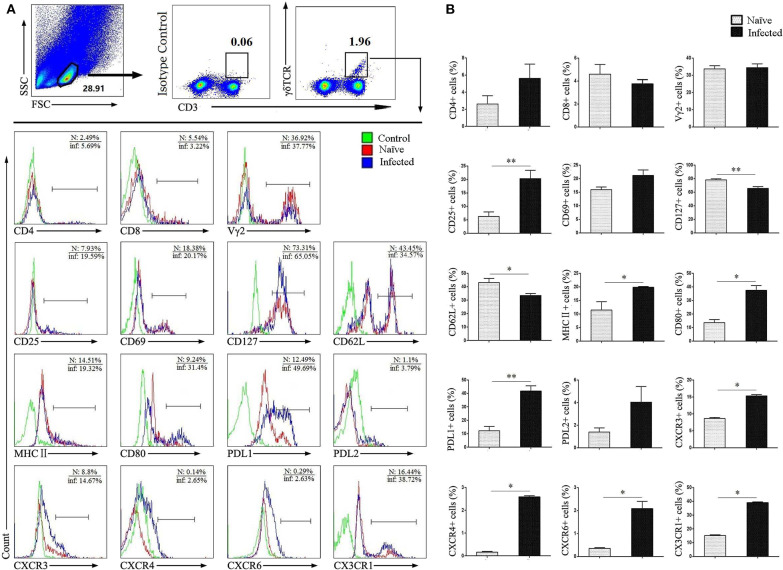
Figure 2.
Surface molecule expression on pulmonary γδ T cells. Single lung cell suspensions were separated from naïve and infected mice, and cells were stained with monoclonal antibodies against mice: CD3, γδTCR, CD4, CD8, Vγ2, CD25, CD69, CD127, CD62L, MHC II, CD80, PDL1, PDL2, CXCR3, CXCR4, CXCR6, and CX3CR1. (A) Representative FACS analysis of three independent experiments is shown. (B) Percentages of surface molecules calculated from FACS analysis, a representative experiment from five independent experiments was shown. The error bars are SD, **P < 0.01, *P < 0.05.

