Figure 2.
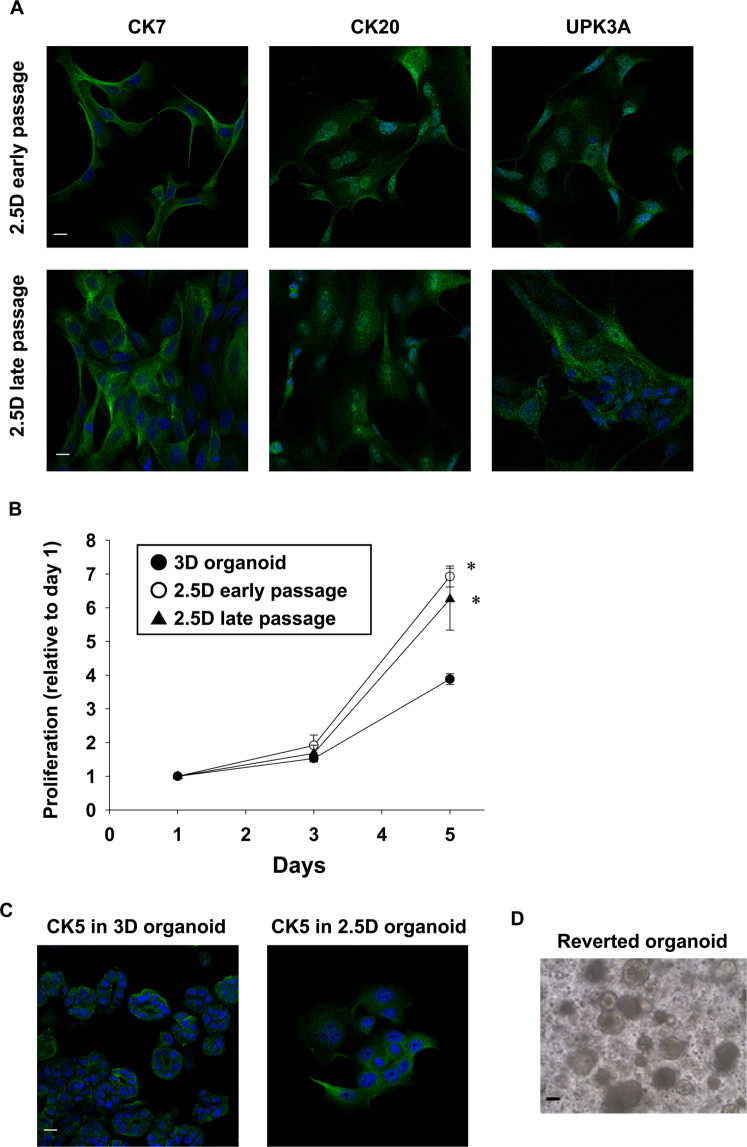
Characterization of BC 2.5D organoids. Expression of urothelial cell markers, CK7, CK20, and UPK3A in 2.5D organoid cells at early (4–8) and late passages (15–20) (A, n = 4). Scale bar: 50 μm. Comparison of cell proliferation at day 1, 3, and 5 between 2.5D organoid at the early and late passage and their original 3D organoid. Cell proliferation was assayed by Prestoblue cell viability reagent and shown as fold increase relative to day 1 (B, n = 6). Results were expressed as mean ± S.E.M. *P < 0.05 vs. 3D organoid. Expression of a basal cell marker, CK5 in the 2.5D organoid cells and parental 3D organoids (C, n = 4). Scale bar: 50 μm. Plasticity of BC 2.5D organoids. Representative bright-field images of the reverted 3D organoids from 2.5D ones (D). Scale bar: 200 μm.

