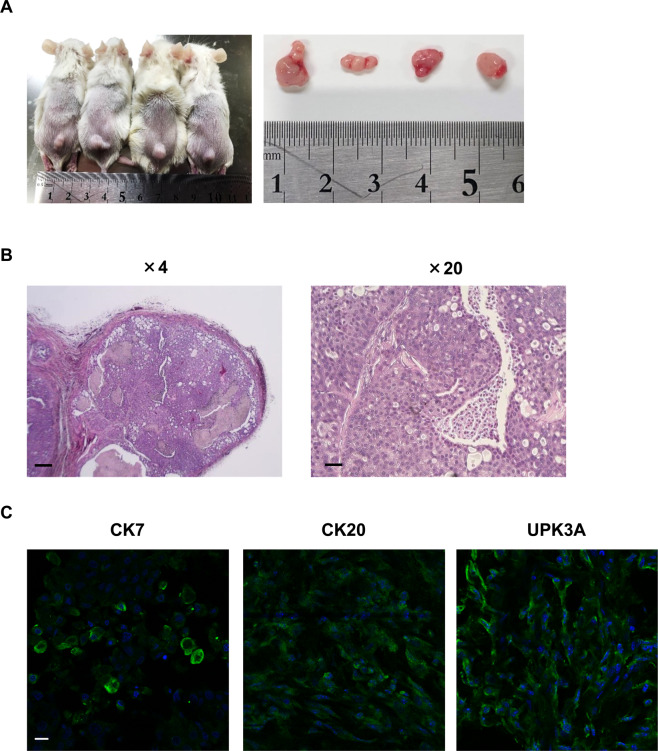
Figure 4.
Tumorigenesis induced by BC 2.5D organoids. The trypsinized 2.5D cells (1×10⁶) were subcutaneously injected into the back of NSG mice (n = 4). Six weeks later, the formed tumors were isolated and sectioned for H&E and immunofluorescence staining. Representative image of the formed tumors and their sizes (A). Representative images of H&E staining of the tumor tissue sections. The enlarged image is shown on the right. Scale bar: 500 and 100 μm (B). Characterization of the cellular components of the formed tumors. Expression of CK7, CK20, and UPK3A in the tumor tissues (C). Representative photomicrographs were shown. Scale bar: 50 μm.

