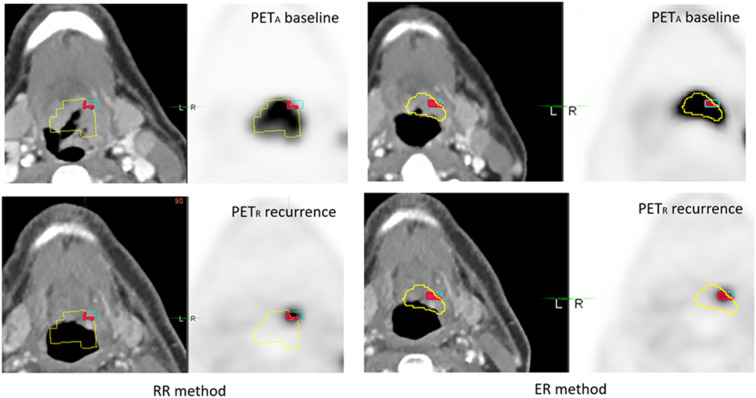
Figure 7.
Example of 49 year-old man with an T4N2M0 oropharyngeal HNSC. During routine clinical monitoring, a FDG-PET/CT scan was performed 7 months after chemoradiotherapy, and demonstrated an occult local relapse. PETA (images on the top) and PETR (images on the bottom) were scanned in treatment position (TP) and coregistered with RR method (left) and ER method (right). A40 subvolume is represented as a yellow line, R40 subvolume as a blue line and A40∩R40 in red area. The OF (A40, R40) index was calculated respectively at 0.19 and 0.64 for RR and ER method.

