Figure 2.
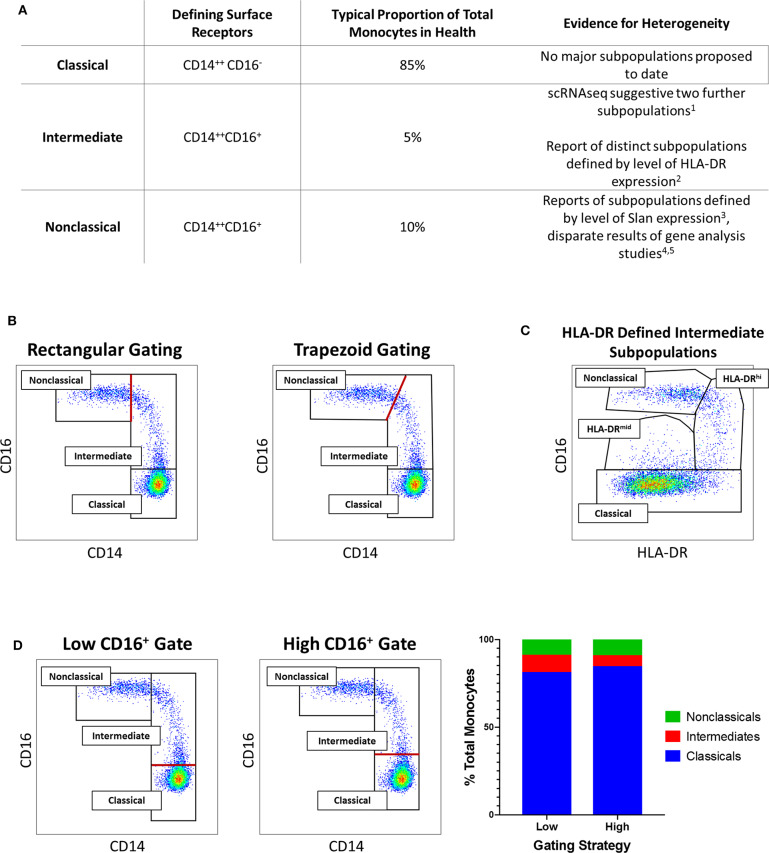
(A) Tabular summary of the CD14/CD16 phenotypes, typical proportionate distribution in health and evidence for further heterogeneity of the three currently-recognized monocyte subsets. [1. (30); 2. (31); 3. (32); 4. (25); 5. (33)] (B) Example of variation in distinction of intermediate and nonclassical monocyte subsets: Flow cytometry dot plots of the three currently-recognized monocyte subsets in peripheral blood mononuclear (PBMC) sample from a healthy adults based on surface expression of CD14 and CD16 [the monocyte population was generated by sequential gating as previously described (29, 31)]. The border between intermediate and nonclassical monocytes may be defined by either a rectangular (left dot plot) or trapezoid (right dot plot) region. (C) Example of intermediate monocyte heterogeneity: In the same sample, two intermediate monocyte subpopulations in blood from a healthy adult distinguished by mid- and high-level of surface HLA-DR expression as previously described (29, 31). (D) Example of variation in distinction of classical and intermediate monocyte subsets: In the same sample, setting a low (left dot plot) or high (middle dot plot) threshold for CD16 positivity results in variation in the defined proportions of the classical and intermediate monocyte subset (bar chart, right). In (B,D), the red lines indicate the part of the gating strategy at which variation may occur.

