
Figure 2.
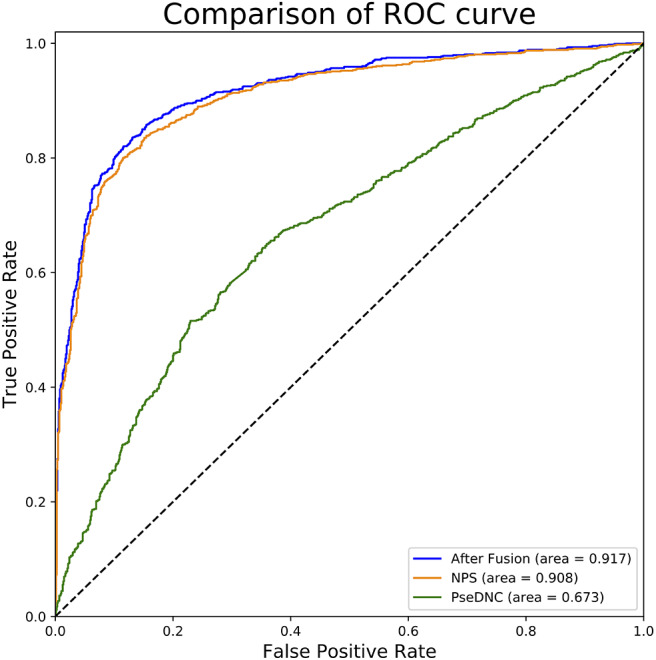
ROC curves of single and fused features. This figure shows the ROC curve results of different features. The green curve characterizes ROC result of PseDNC and the orange one for NPS. The ROC curve of fused features is represented by blue.
Official websites use .gov
A
.gov website belongs to an official
government organization in the United States.
Secure .gov websites use HTTPS
A lock (
) or https:// means you've safely
connected to the .gov website. Share sensitive
information only on official, secure websites.
ROC curves of single and fused features. This figure shows the ROC curve results of different features. The green curve characterizes ROC result of PseDNC and the orange one for NPS. The ROC curve of fused features is represented by blue.