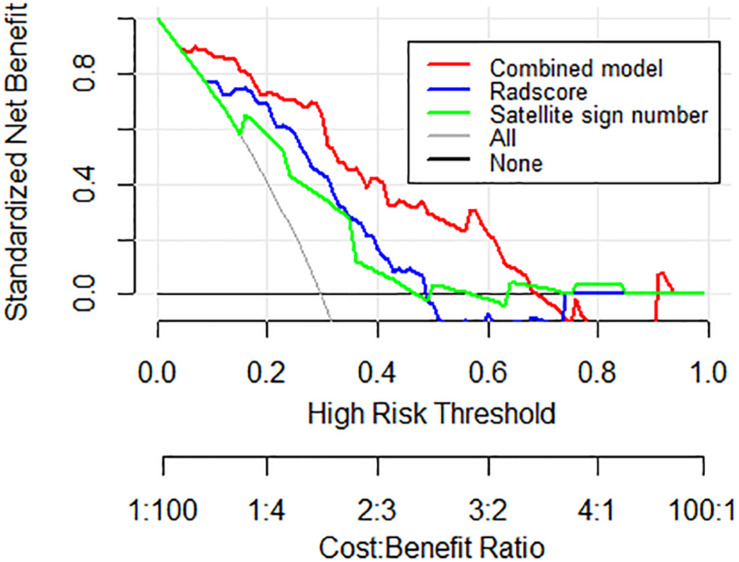
FIGURE 5.
Decision curve analysis for the nomogram model in the external validation cohort. The gray line stands for the assumption that all patients developed hematoma expansion, and the black line represents the assumption that no patient had hematoma expansion. Compared to other models, the highest curve of the nomogram model with more area is the optimal decision making for maximal net benefit in hematoma expansion prediction.

